For the first time in years, Duke is reeling heading into its first matchup with North Carolina. Beginning with Wednesday’s rivalry game, the Blue Devils’ final eight conference contests will include two matchups with the Tar Heels and a road date with surging Florida State. With the postseason looming now is the time to explore how Duke might improve and survive the upcoming slate.
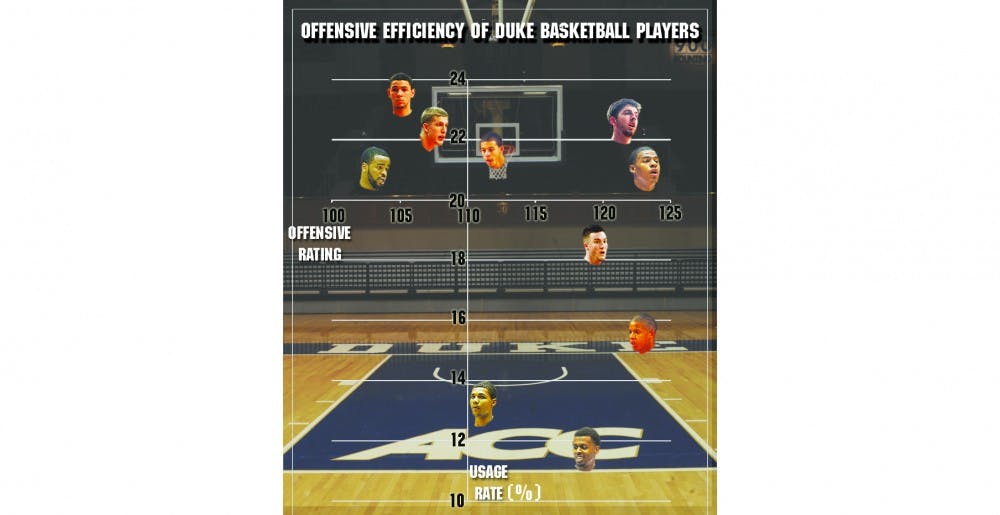
To help make some judgments about this year’s roster, we can chart a player’s contributions based on advanced offensive metrics developed by statistician Ken Pomeroy. On the horizontal axis of the adjacent graph is a statistic called “offensive rating” for each of the Blue Devils. The actual formula is quite complicated, but the interpretation is fairly simple. It gives a player credit for anything that produces points—field goals, free throws, assists and offensive rebounds—while docking him for things that help the other team score—missed field goals and free throws, and turnovers. A rating of 100 is considered to be pretty good, but since we expect Duke to be better than average offensively, I have bumped the baseline up to 110.
On the vertical axis is a metric called “usage rate.” Basically this measures how involved a player is in the offense. Strictly speaking, it tells how many possessions end with the ball in a given player’s hands, as a percentage of the possessions that he is on the floor. A player can “end” a possession in one of three ways—by making a shot, by missing a shot that ends up being rebounded by the defense and by turning the ball over. A usage rate of 20 percent is about average.
So the best players in the game are high-usage and high-efficiency, and they appear in the top right quadrant of the chart—they have scoring ability, and they use it often.
The two Blue Devils who appear here are Ryan Kelly and Quinn Cook, who have not been consistent starters but should now be entrenched in the starting lineup. The offense cannot afford to be without Kelly’s inside-outside ability. He finishes at a nearly 50-percent clip inside the arc and drains a remarkable 45 percent of his 3-pointers. He does a great job getting to the line and converts at an 80-percent clip once he gets there, and he adds 5.4 rebounds and 1.1 blocks per game to boot.
And Cook is the answer for a team that had lacked an obvious solution at point guard. He is a strong finisher in the lane despite his small size and an excellent passer—he dishes out nearly 3.5 assists for every turnover, and his assist rate would translate to 5.4 assists per game if he had played as many minutes as Austin Rivers. Throw in that he’s also an 80-percent free-throw shooter and a tenacious defender, and he ought to have earned himself the point-guard job.
On the opposite end of the value spectrum is the top left quadrant, where we find the players who are not particularly efficient scorers, but who nonetheless try to score often.
Perhaps the most surprising player to be found here is Rivers. He has certainly grown over the course of his freshman campaign and his scoring abilities now compare favorably with last year’s leading scorer Nolan Smith, and he is a better long-range shooter than Smith was. Smith distinguished himself as a star and a leader, though, with his other contributions. He added 4.5 rebounds and 5.1 assists per game, and Rivers falls short in those categories, with just 3.1 boards and 2.0 assists per contest, not to mention more turnovers than assists on the season. Rivers is already establishing himself as a top-notch scorer, but if he wants to ascend to star level for this year’s Duke team, he will need to do more than just fill up the highlight reel with dribble drives.
The quadrant with the most upside is the bottom right, where you find the high-efficiency, low-usage players. Players cannot always maintain their efficiency while looking to score more, but these players might benefit from a bigger role.
By that standard, Miles Plumlee should be given some of his brother’s playing time. There is no doubt that Mason has more upside than Miles, and indeed the younger Plumlee plays nearly twice as many minutes. But the junior’s production simply does not approach that of his older brother. You could argue that Miles would not be able to maintain his fantastic 65.2-percent performance from the field if he shot as much as Mason does—Mason has nearly twice as many attempts—but given that the elder brother shoots nearly 20 percent better from the free-throw line, he would be able to fall off a great deal from the floor and still be more efficient than Mason. Although Mason is a better rebounder on the defensive glass, Miles holds his own in that area and is a far better offensive rebounder—one of the best in the nation, in fact. There is no denying Mason’s greater ability, but right now Miles is the more effective player, and their playing time ought to reflect that.
The talent is here for the Blue Devils to finish the year strong and make a deep postseason run, and perhaps a few minor adjustments can be made to maximize their potential and their chances.
Get The Chronicle straight to your inbox
Signup for our weekly newsletter. Cancel at any time.