
Editor's note: This story is part of a series about the Class of 2027 based on a survey conducted by The Chronicle. You can read more about our methodology and limitations here, or read all of our survey coverage here.
We asked the Class of 2027 about their beliefs, lifestyle choices and political leanings, from religion to drug use to whether they are registered to vote.
Religion
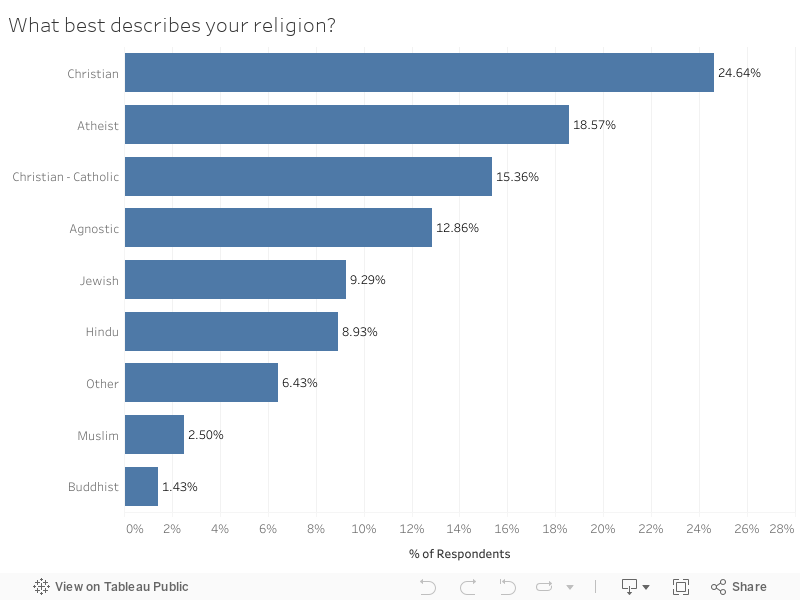
About a quarter of respondents are Christian, and 15% of respondents are Catholic. Almost one in five respondents were atheists, and about one in ten respondents were Jewish. 12.86% of respondents identified as agnostic, 8.93% as Hindu, 2.50% as Muslim and 1.43% as Buddhist. 6.43% of respondents said they observed another religion not listed.
Over 50% of respondents said they were not very religious or were not religious at all. 22.50% said they were not “very” religious, 19.29% were simply “religious,” 20.71% were “somewhat” religious, while only 6.43% of respondents classified themselves as “very” religious.
Lifestyle
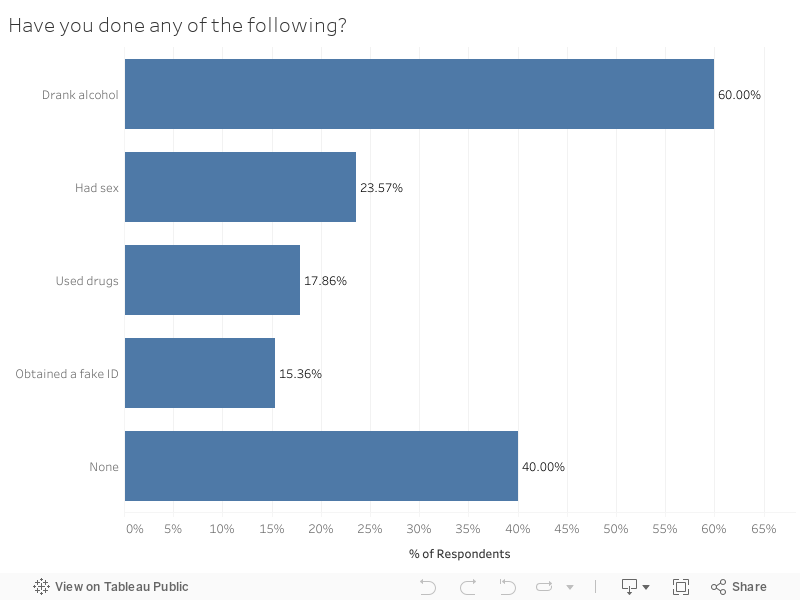
60% of respondents have drunk alcohol, 23.57% have had sex, 17.86% have obtained a fake ID and 15.36% have used drugs. 40% of respondents said they have done none of these.
Religion and Lifestyle
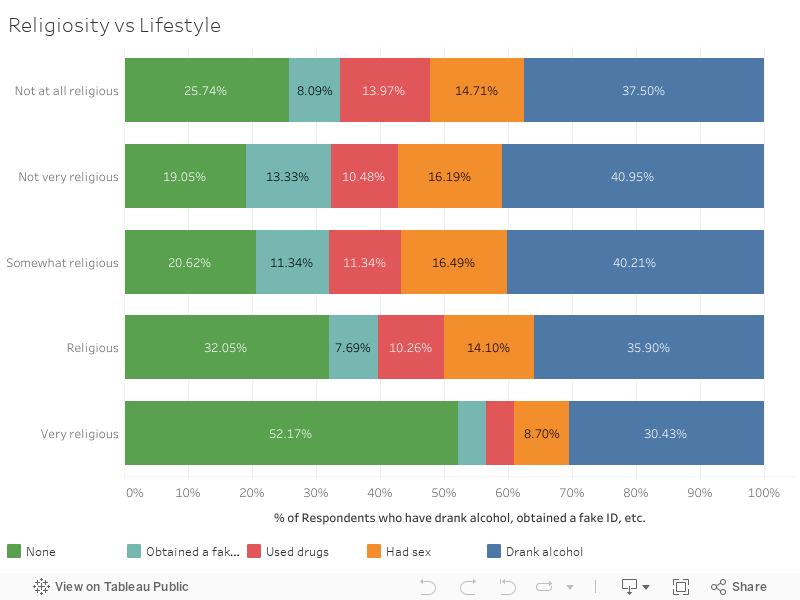
The survey results suggested that students who are “very religious” and “religious” are far less likely to have drunk alcohol, had sex, used drugs or obtained a fake ID than those who identify as not at all religious, not very religious, or somewhat religious.
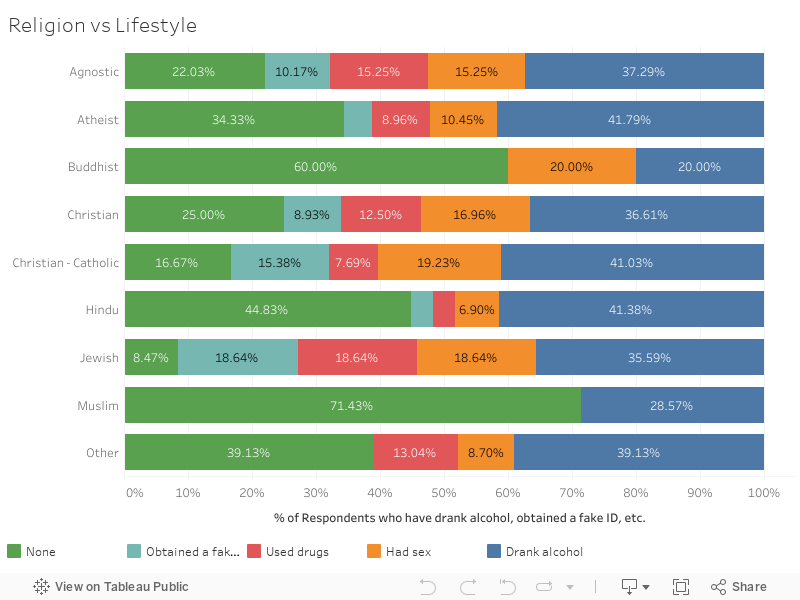
By comparing specific religions with lifestyle choices, we found that over 60% of Buddhist and Muslim students had not obtained a fake ID, used drugs, had sex or drank alcohol. Jewish and Catholic students were more likely to have done these activities. Only 8.5% of Jewish students and 16.7% of Catholic students had not done any of these activities.
Politics
When asked to classify their political beliefs. 22.50% of respondents identified as very liberal, 35.71% as somewhat liberal, 27.50% as moderate, 9.64% as somewhat conservative and 4.64% as very conservative.
Religion and Political Leanings
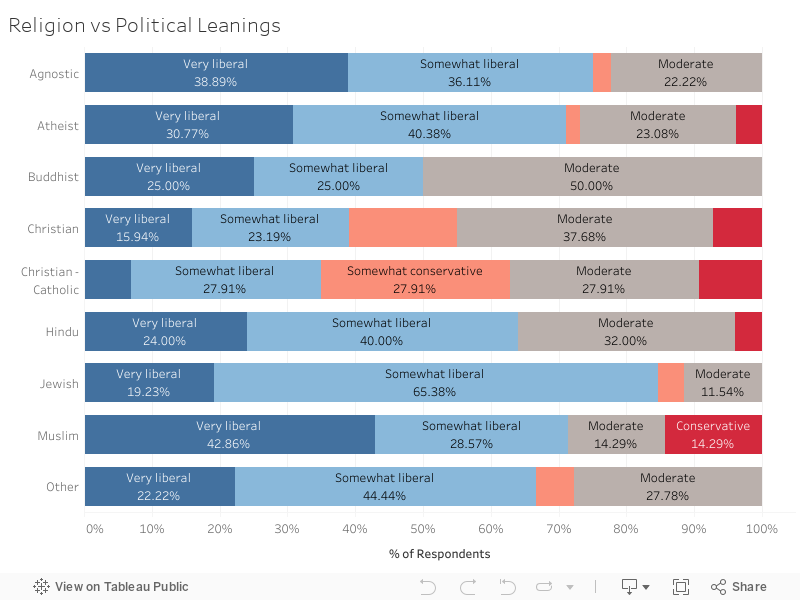
Muslim students were more likely to be “very liberal”, and Jewish students were more likely to be “somewhat liberal.” Catholic, Christian and Buddhist students tended to be more moderate and conservative than agnostic and atheist students, as well as students of other faiths.
Religiosity and Political Leanings
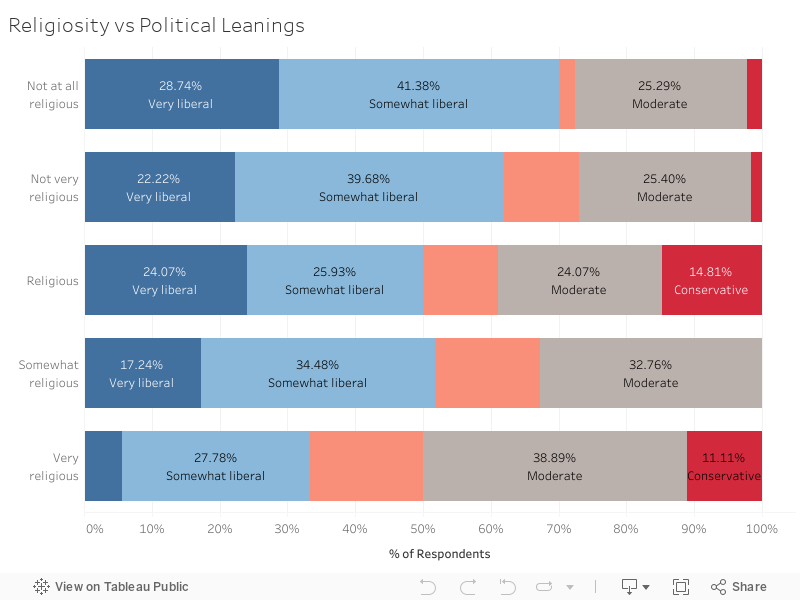
“Religious” respondents were about equally likely to be very liberal, somewhat liberal or moderate. ” Students who indicated they were “not very religious” and “not at all religious” were more likely to be very liberal or somewhat liberal. In contrast, participants who self-described as “somewhat religious” and “very religious” leaned toward moderate, somewhat conservative and conservative” responses.
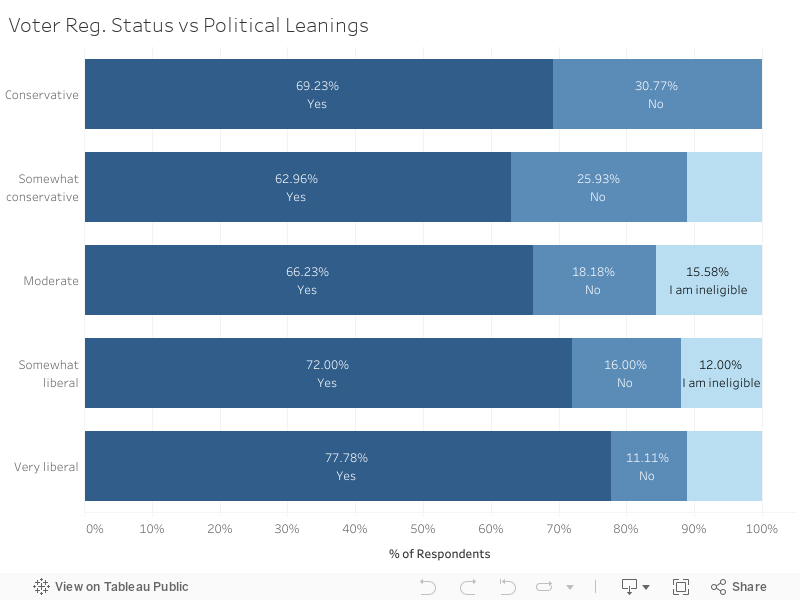
Across the scale of political leanings, the majority of eligible students were registered to vote. Conservative students were the most likely to not have registered, consisting of nearly a third of respondents. The highest percentage of registered voters was in the “very liberal” category at 77.78%.
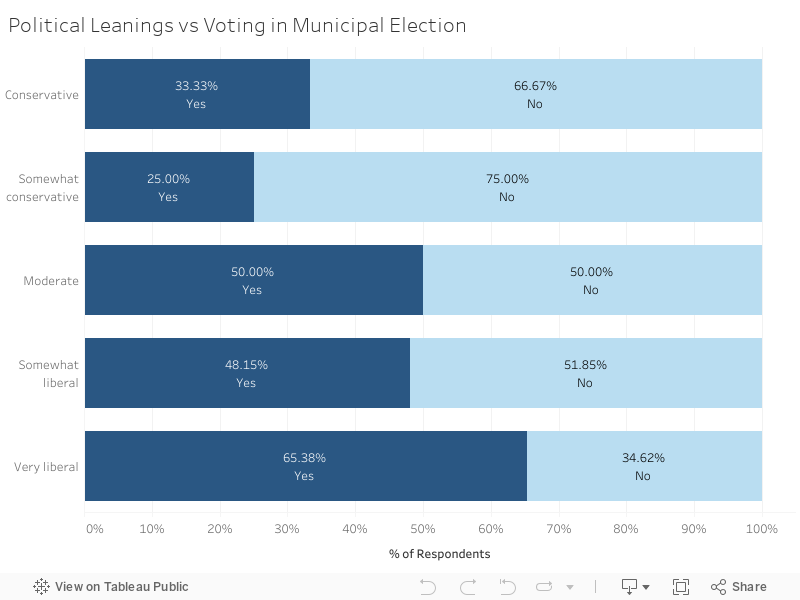
Most first-year respondents who are “conservative” and “somewhat conservative” were not planning to vote in the 2023 municipal election, with 66.67% and 75% answering “No,” respectively. Students who are in the “moderate” and “somewhat liberal” categories were split relatively evenly between “Yes” and “No” responses. On the other hand, most of the first years who identified as “very liberal” (65.38%) were planning to vote.
Get The Chronicle straight to your inbox
Signup for our weekly newsletter. Cancel at any time.
Sophie Endrud is a Trinity first-year and a staff reporter for the news department.
Grace Ghoorah is a Trinity first-year and a staff reporter for the news department.