
Editor's note: This story is part of a series about the Class of 2027 based on a survey conducted by The Chronicle. You can read more about our methodology and limitations here, or read all of our survey coverage here.
This year’s survey asked the Class of 2027 about academic, cultural, health and wellness and mental health resources on campus. For each campus resource, survey respondents could select if they were “aware of” the resource and whether they had “used” the resource.
The top five most-used resources were weight and exercise rooms at either Wilson or Brodie Recreation Centers (65%), Student Health (nearly 50%), Campus Pharmacy (37%), Arts Annex (26.4%) and group fitness classes at either Wilson or Brodie Recreation Centers (26%).
Food point spending and dining preferences
Prices at several campus dining locations increased in fall 2022 due to inflation, causing some students to run low on food points. However, many food items have since lowered in price. The Devil’s Krafthouse southwest chicken cobb salad, for example — which cost $14.60 before tax in fall 2022 — now costs $12.99. Other food items have increased in price, such as the Sazón protein arepa bowl, which cost $11.40 in fall 2022 and now costs $11.89.
Additionally, students expressed concerns about the availability of affordable dining options after Panda Express and The Loop, two Duke Dining staples, ceased operations in May 2023.
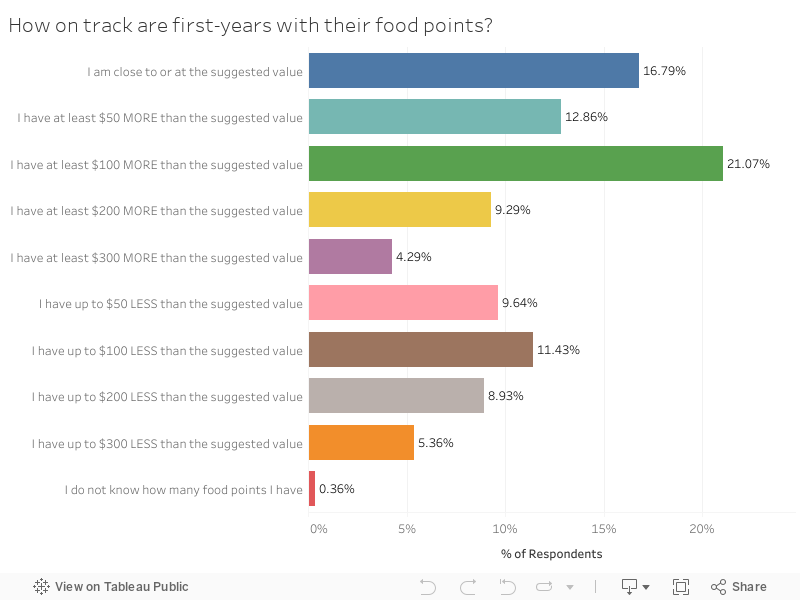
About 64.3% of surveyed first-years were at or above the suggested food point balance or had a surplus of funds, while last year’s percentage was about 75%.
This year, about 5.4% of respondents were below the suggested balance by $300 or more. 8.9% were up to $200 below, 11.4% were up to $100 below and 9.6% were up to $50 below.
Last year’s survey found that about 2.6% of respondents were below the suggested balance by $300 or more. 4.2% were up to $200 below, 10% were up to $100 below, and 7.7% were up to $50 below.
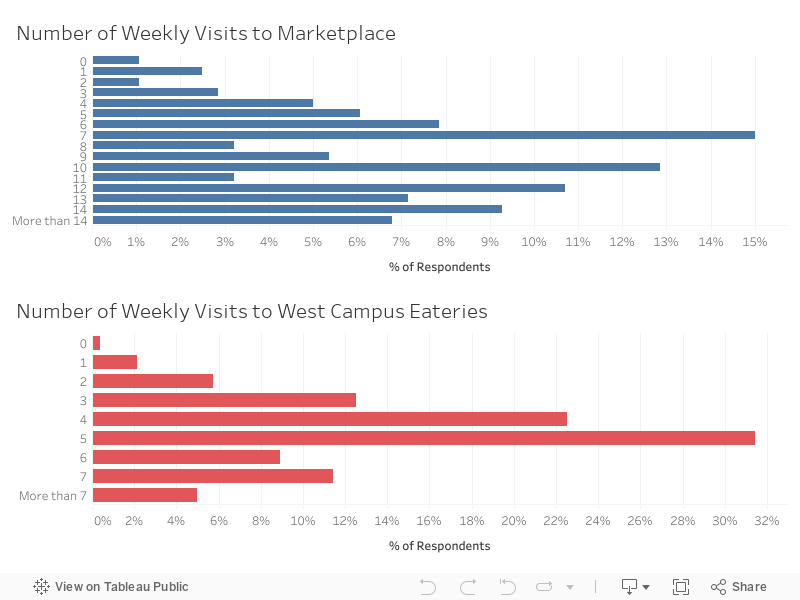
The median number of weekly Marketplace visits is nine. The largest number of respondents (15%) ate at Marketplace seven times a week, about once per day. A third of respondents visited West Campus eateries (Brodhead Center, Zweli’s, etc.) five times a week, while the median number of visits was also five.
Academic Resources
The survey listed the following academic resources on campus: Ask a Librarian; the Career Center; Directors of Academic Engagement; GRE/MCAT Prep; group tutoring, LD/ADHD Support; Learning Consultations; and Office of Health Professions Advising; other pre-professional advising; pregraduate advising; the STEM Advancement through Group Engagement Program (SAGE); Student Disability Access Office; Study Connect at the Academic Resource Center; Subject Specialists at Duke Libraries and the Thompson Writing Program writing studio.
Only six respondents were not aware of any academic resources. 171 respondents (61.4%) reported using at least one academic resource.
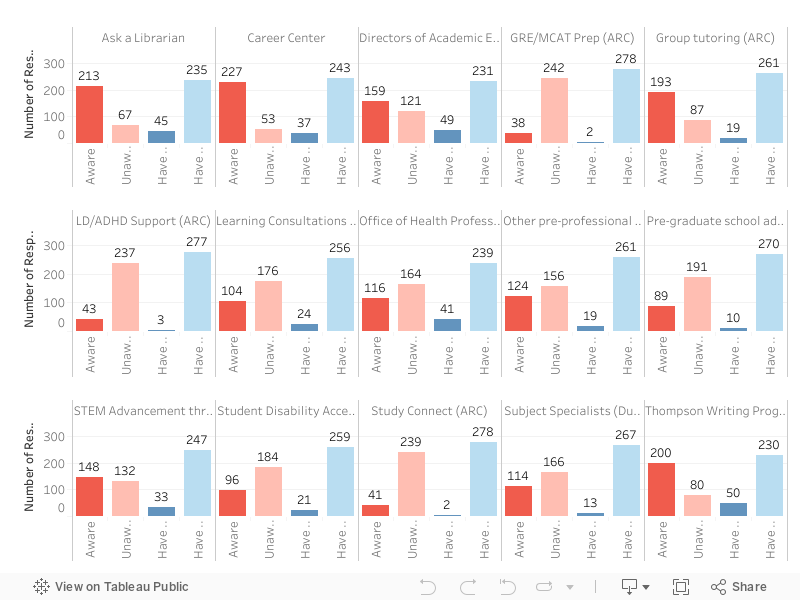
The most frequently accessed resource was the Thompson Writing Studio, used by 50 respondents (17.9%), followed by the Directors of Academic Engagement, used by 49 respondents (17.5%). The least common resources were GRE/MCAT Prep and Study Connect, each used by two respondents.
Similar to last year, respondents were generally less aware of advising opportunities for graduate school, pre-law and pre-health, and generally more aware of frequently-marketed resources such as the writing studio, Ask a Librarian and Career Center.
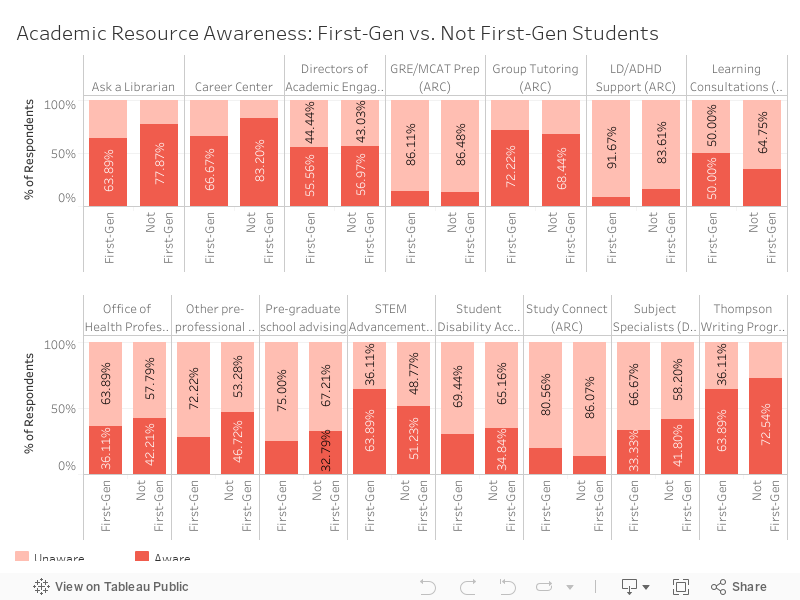
Unlike last year, first-generation students were less aware of academic resources than non-first-generation students, except for GRE/MCAT Prep, Group Tutoring, Learning Consultation, SAGE and Study Connect.
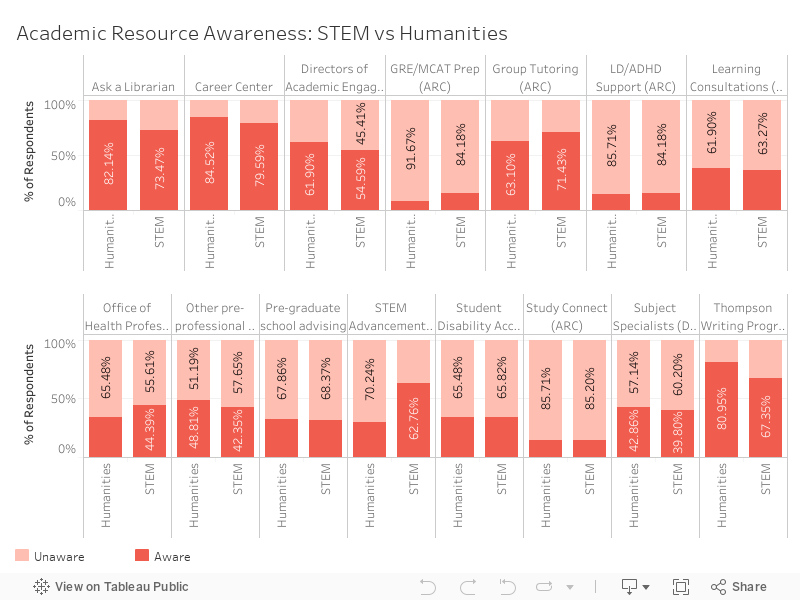
Respondents who plan on pursuing majors in STEM-related areas were more aware of resources tailored to their fields of study, such as the Office of Health Professions Advising and SAGE. Students who plan on pursuing the humanities were slightly more aware of the Thompson Writing Center, law and business pre-professional advising, Ask a Librarian, and the Career Center. Both groups showed similar awareness in LD/ADHD Support, Learning Consultation, Pre-graduate school advising and Study Connect.
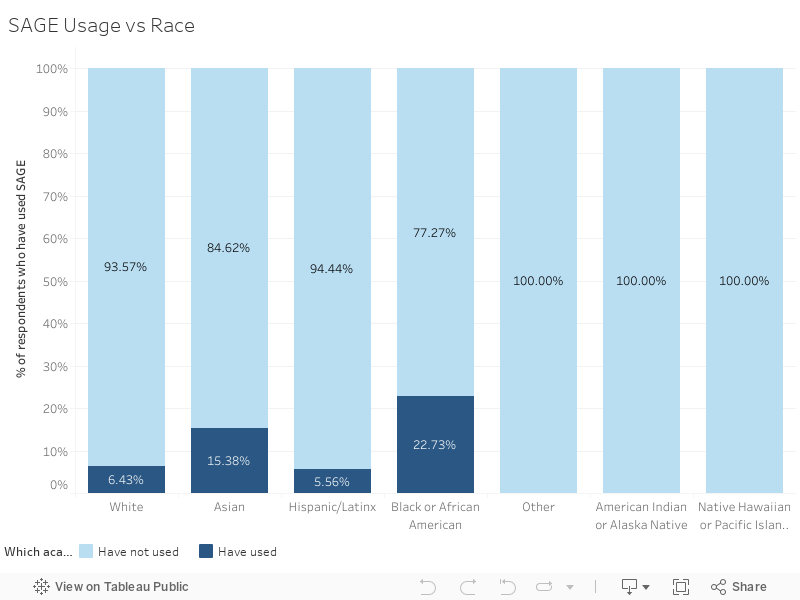
Like last year, students on financial aid or from minority backgrounds used SAGE more frequently. 15% of respondents on financial aid had used SAGE compared to 9% of respondents not on financial aid. Black or African American students had the greatest proportion of SAGE users among their own demographic. 22.7% of Black or African American students surveyed have used SAGE, compared to the 9.5% of non-Black students who have.
Cultural Centers
Respondents were asked about the following cultural resources on campus: Center for Multicultural Affairs, Center for Muslim Life, Center for Sexual and Gender Diversity, Disability Cultural Center, Freeman Center for Jewish Life, International Student Center, Mary Lou Williams Center for Black Culture and the Women’s Center.
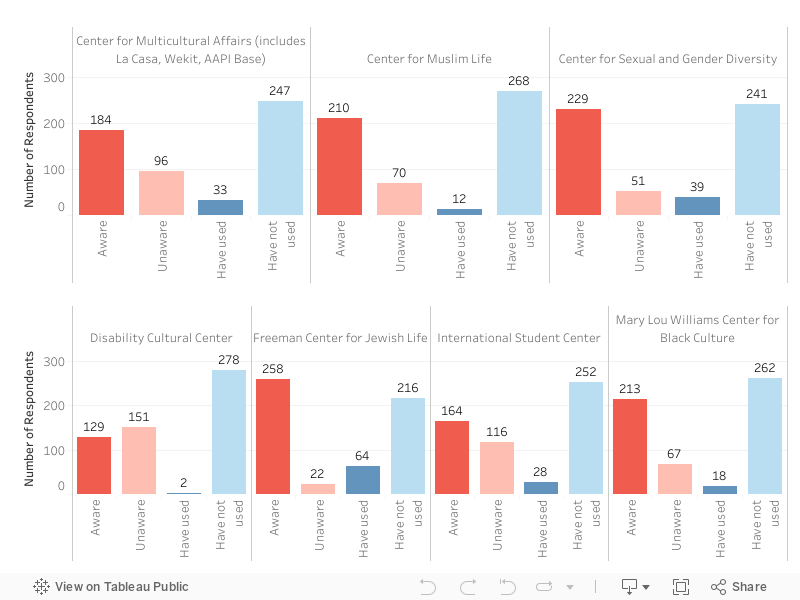
Consistent with last year, the most frequently accessed cultural center was the Freeman Center. Only two respondents reported using the Disability Cultural Center.
The survey data revealed that students belonging to a culture or affinity group used cultural centers more frequently. Of the respondents, 22 out of 37 international students (about 59.4%) have used the International Student Center, compared to the 2.5% of domestic students. 92.3% of Jewish students have used the Freeman Center, compared to 48.4% of non-Jewish students. 85.7% of Muslim students have used the Center for Muslim Life, compared to 5.9% of non-Muslim students. 68.2% of Black or African American students have used the Mary Lou Williams Center, versus 2.3% of students who did not identify as Black or African American.
30.6% of Hispanic/Latinx students, 14.5% of Asian students, 22.7% of Black or African American respondents, 66.7% of American Indian or Alaskan Native students and 100% of Native Hawaiian respondents have used the CMA, compared to 4.3% of students who identified as white. The CMA manages three identity spaces in the Bryan Center: La Casa, the primary Hispanic/Latinx affinity space on campus; AAPI BASE, the Asian American Pacific Islander affinity space and Wekit, the Native American and Indigenous affinity space.
The survey also revealed that students who identified as queer used the CSGD more frequently. 38.24% of queer respondents have used the CSGD, compared to 6.53% of heterosexual respondents.
Health and Wellness
The survey listed the following health and wellness resources on campus: activities at the Wellness Center, Arts Annex, Campus Pharmacy, Campus Smiles Dentistry, diet and nutrition lecture courses, Duke Health COVID-19 Hotline, Feed Every Devil food point bank, nutrition services at Student Health, Outdoor Adventures with Personal Trips, Student Health and group fitness classes and weight/exercise rooms at Wilson Recreation Center.
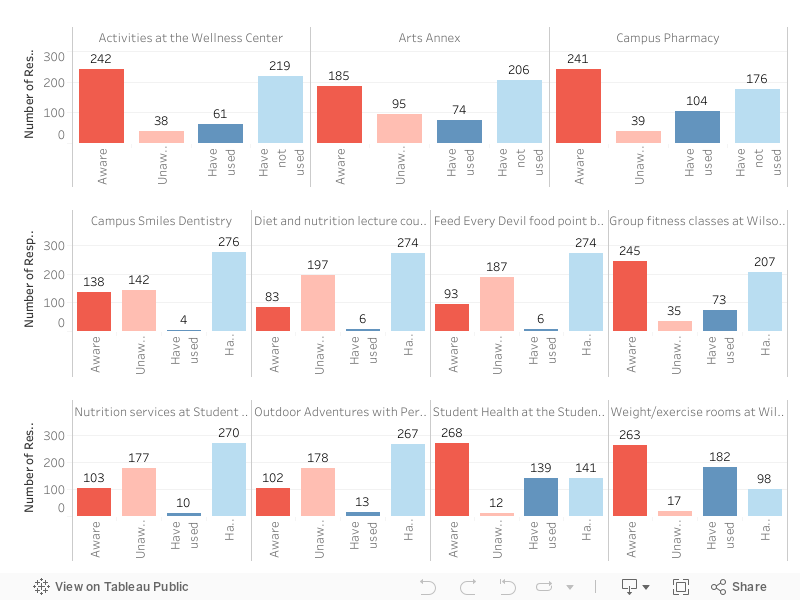
The most frequently accessed health and wellness resources were the weight rooms at Wilson and Brodie recreation centers, used by 65% of respondents. Student health was also widely accessed, with just under half of respondents. The least accessed resources were Campus Smiles Dentistry, with only two respondents having used the resource, as well as the diet and nutrition lecture courses and Feed Every Devil, with only 6 users each.
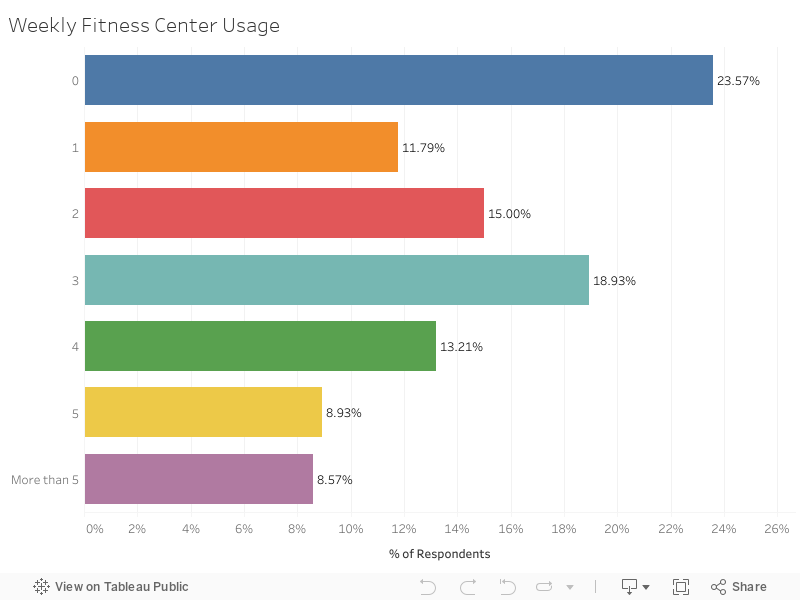
23.6% of respondents never accessed Duke’s recreation centers. 27% used them once or twice per week. 32% three or four times per week, and 17.5% five or more times per week.
Immunocompromised students used the Campus Pharmacy slightly more frequently than non-immunocompromised students. Moreover, respondents who reported voluntarily wearing a mask, even when not required, have a higher awareness and more frequent usage of Student Health.
Mental Health
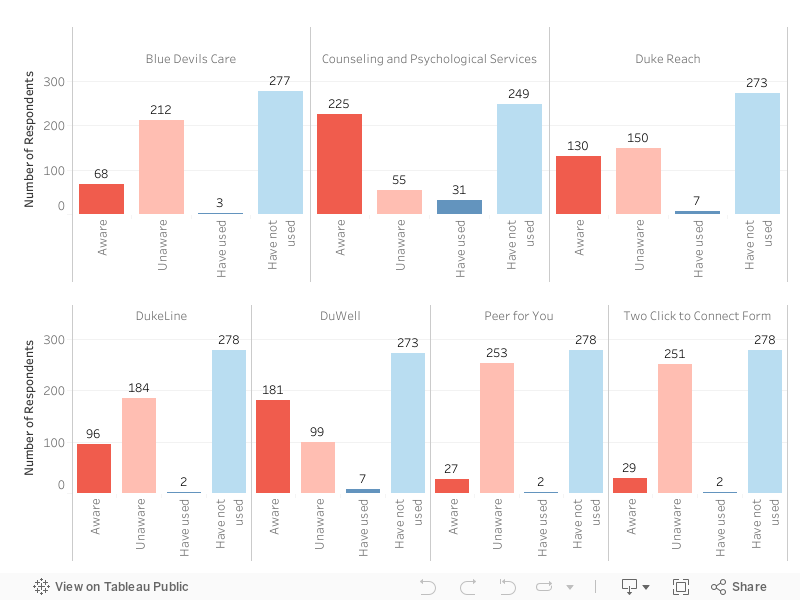
Respondents reported their awareness and usage of seven mental health resources: Blue Devils Care, Counseling and Psychological Services, DukeReach, DukeLine, DuWell, Peer for You and Two Click to Connect Form. While most respondents were aware of CAPS (80.4%) and DuWell (64.6%), these resources had low usage rates of 11% and 2.5%, respectively. 10.4% of respondents were aware of Two Click to Connect Form and 9.6% were aware of Peer for You.
How first-years are informed of resources
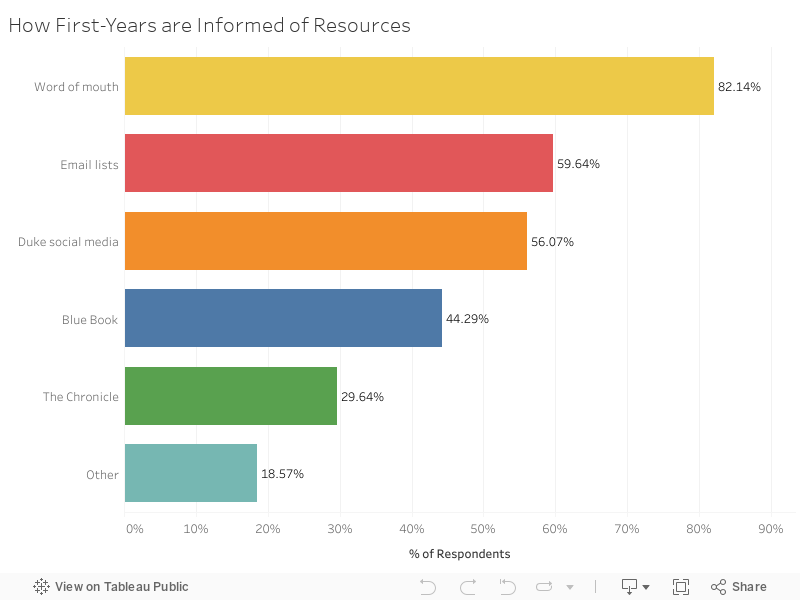
Respondents could select multiple ways that they learned of resources at Duke. A majority (82%) said they were informed by word of mouth. Nearly 60% were informed by email lists, 56% by official Duke social media accounts, 44% by the Blue Book, nearly a third by The Chronicle and about 19% by other channels.
Amy Liu contributed data analysis.
Get The Chronicle straight to your inbox
Signup for our weekly newsletter. Cancel at any time.

Katie Tan is a Trinity senior and digital strategy director of The Chronicle's 119th volume. She was previously managing editor for Volume 118.