
Editor's note: This story is part of a series about the Class of 2027 based on a survey conducted by The Chronicle. You can read more about our methodology and limitations here, or read all of our survey coverage here. Data analysis was conducted by the first-year survey team.
Demographics and financial aid
We asked respondents in the Class of 2027 about their race, ethnicity, gender and sexual orientation; from where and what type of community they are from; whether they are first-generation college students; and their family income.
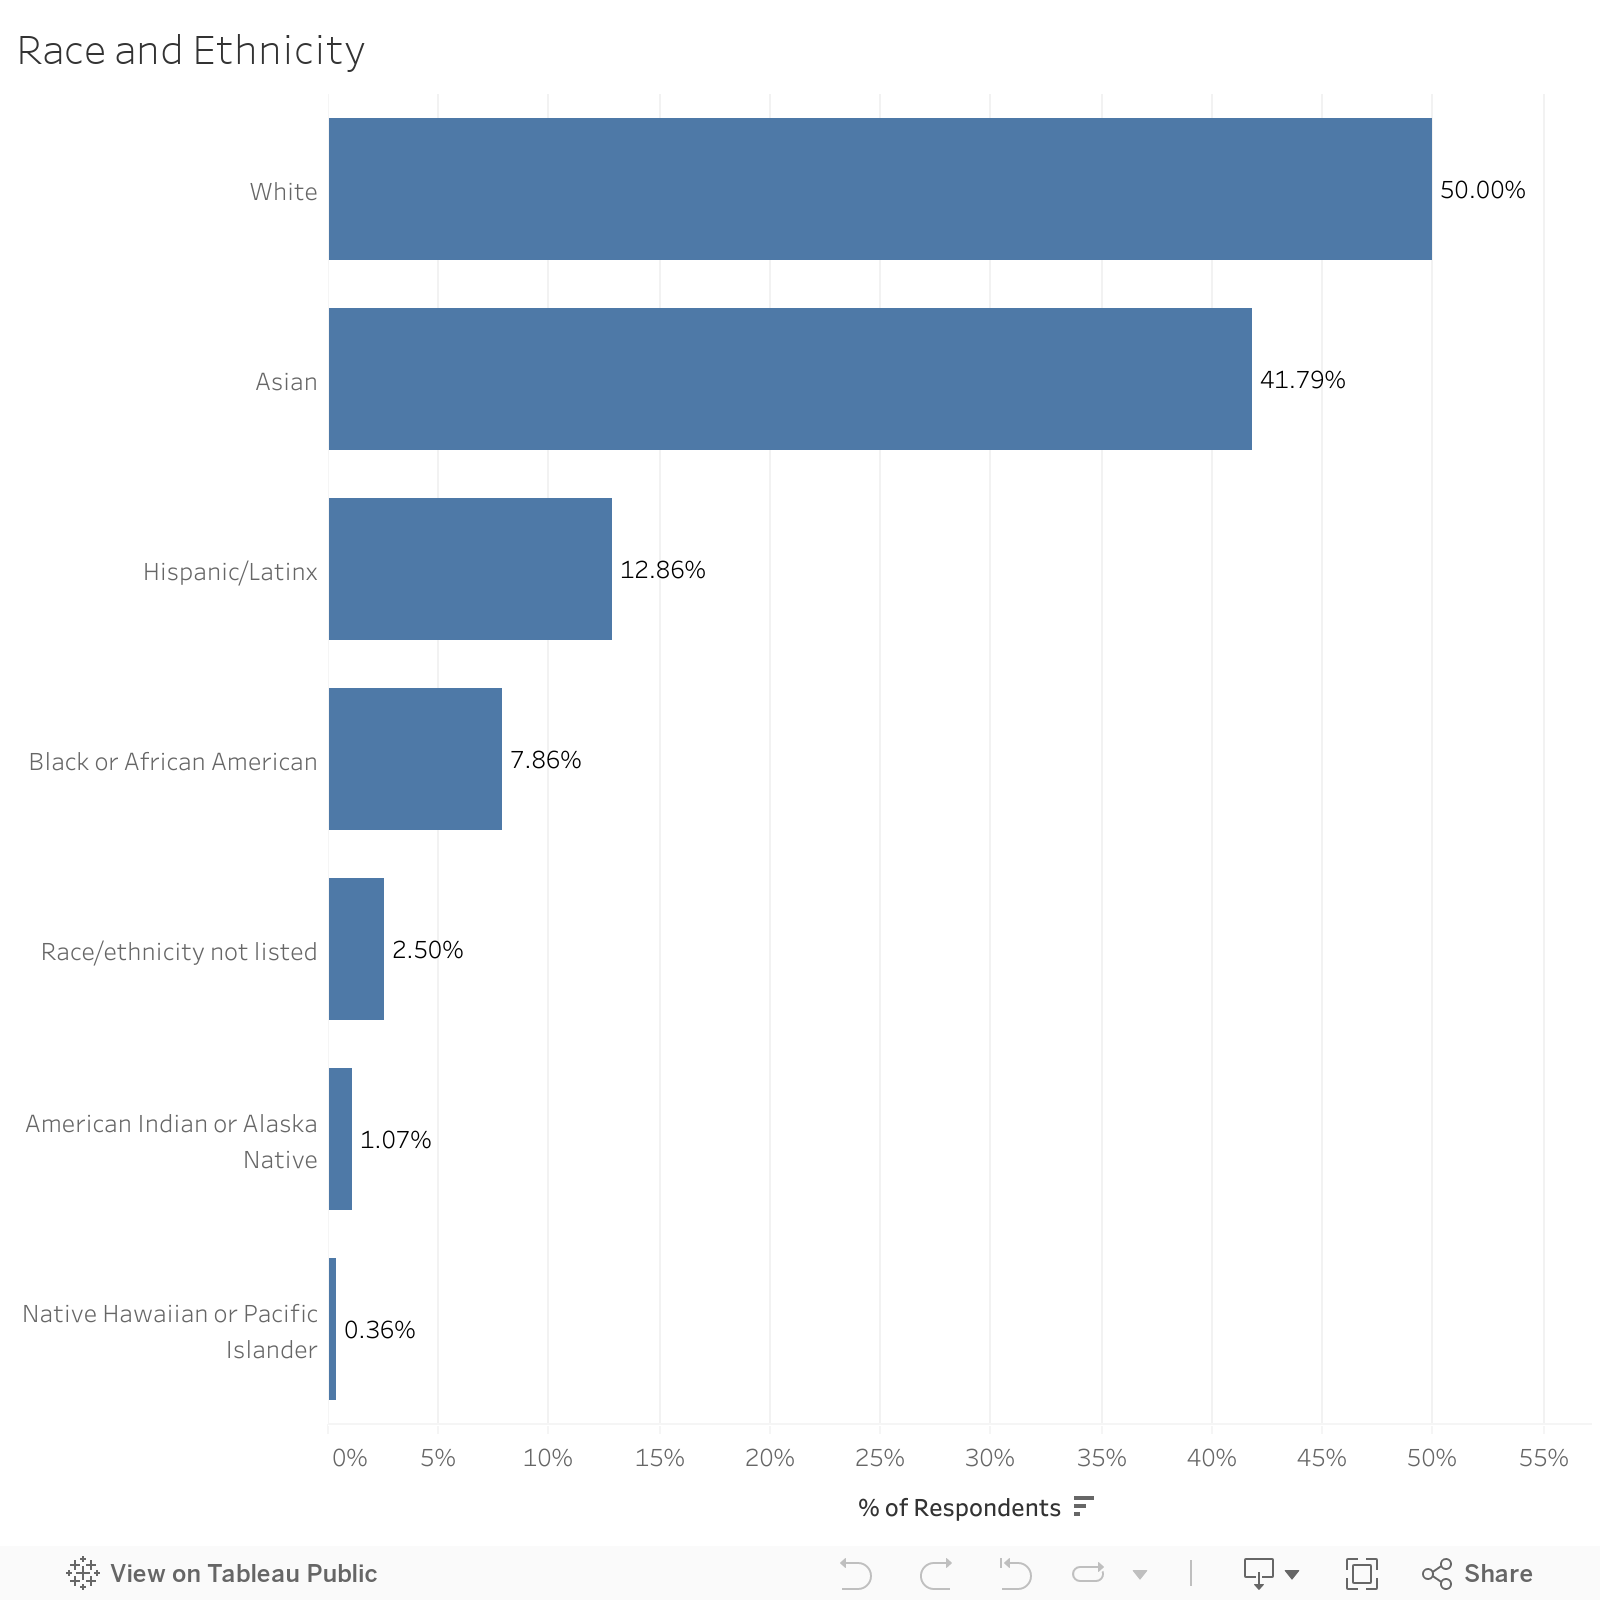
In our survey, 50% of students identified as white, 41.79% identified as Asian, 12.86% identified as Hispanic/Latinx, 7.86% identified as Black, 1.07% identified as American Indian or Alaskan, 0.36% identified as Native Hawaiian or Pacific Islander and 2.5% identified as other. Students could select multiple identities.
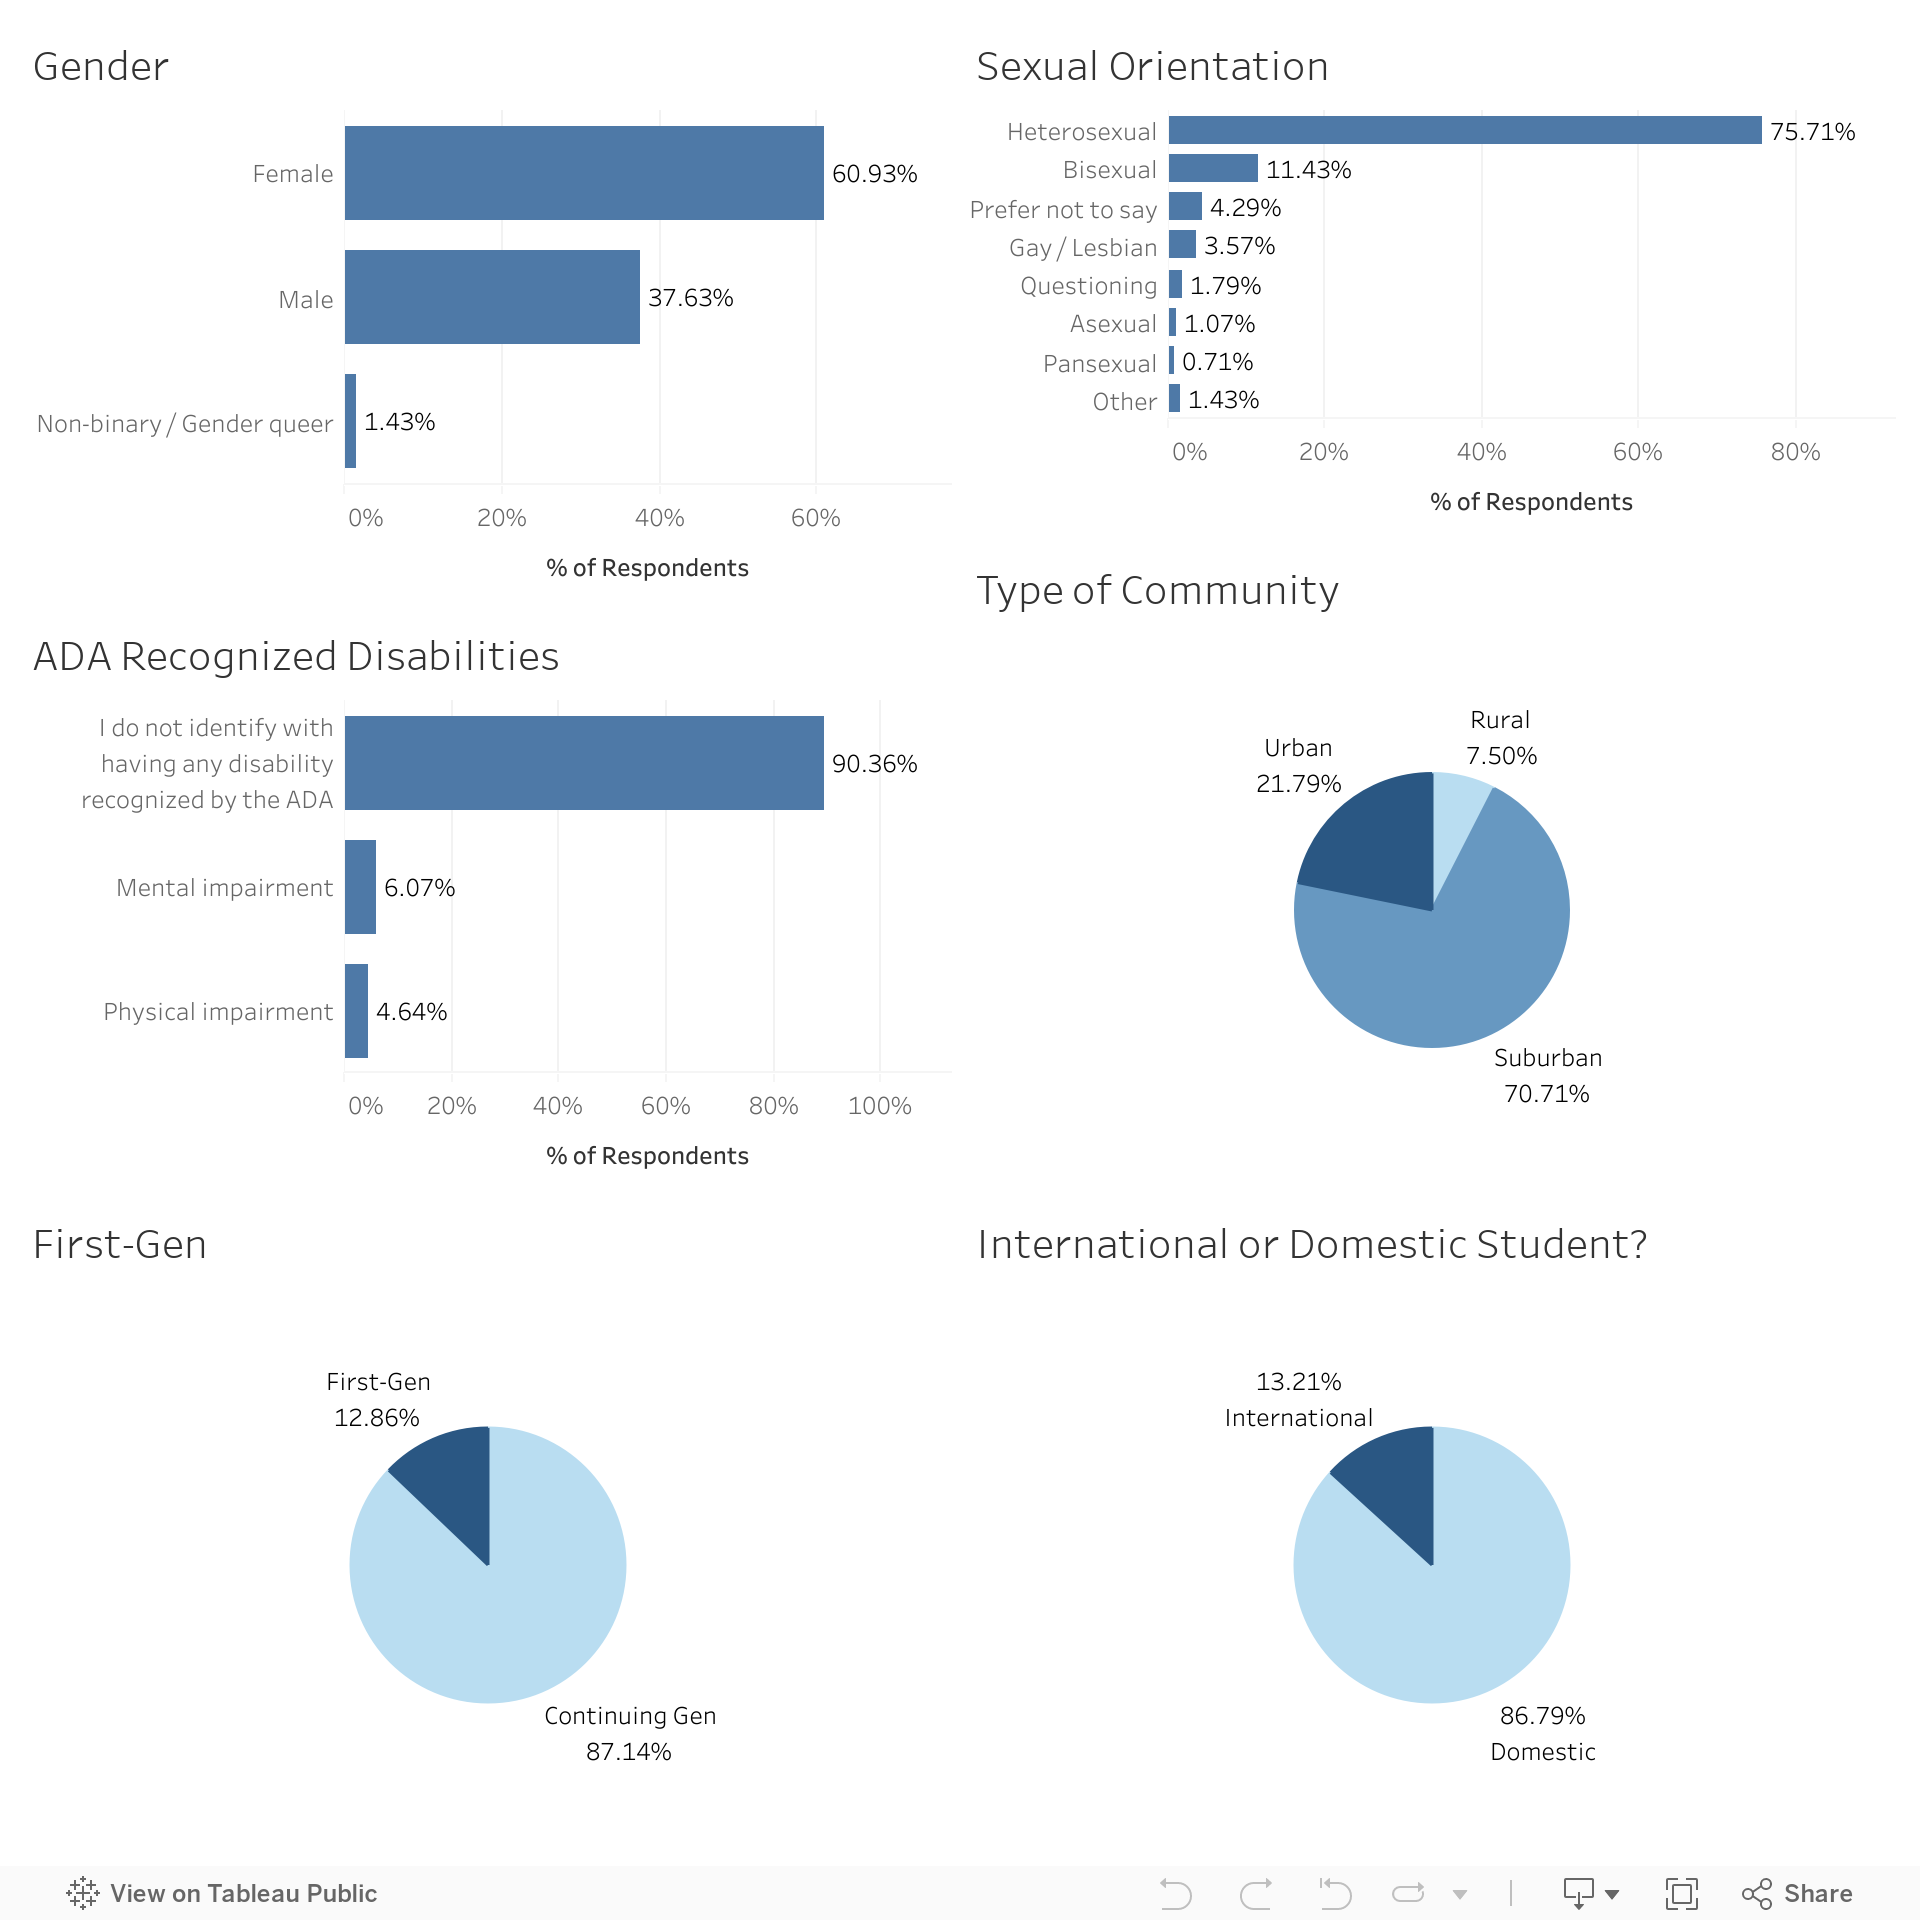
The survey also found that 60.93% of respondents were women, 37.63% were men and 1.43% were non-binary or gender queer.
Among students who chose to share their sexual orientation, 75.71% identified as heterosexual, 11.43% identified as bisexual, 3.57% identified as gay or lesbian, 1.07% identified as asexual, 0.71% identified as pansexual, 1.43% identified as other and 1.79% were questioning. About 4% of respondents preferred not to share their sexual orientation.
This year, we modified our question regarding disability to reflect the Americans with Disabilities Act’s definition of a disability, which defines a person with a disability as someone who has a physical or mental impairment that substantially limits one or more major life activities.
Students could identify as having multiple impairments. 9.64% of respondents have a disability under the ADA’s definition. 4.64% of respondents identified as having a physical impairment and 6.07% identified as having a mental impairment.
70.71% of respondents said they were from suburban areas, while 21.79% were from urban areas and 7.5% were from rural areas. 12.86% of respondents are first-generation college students, and 13.21% of respondents are international students.
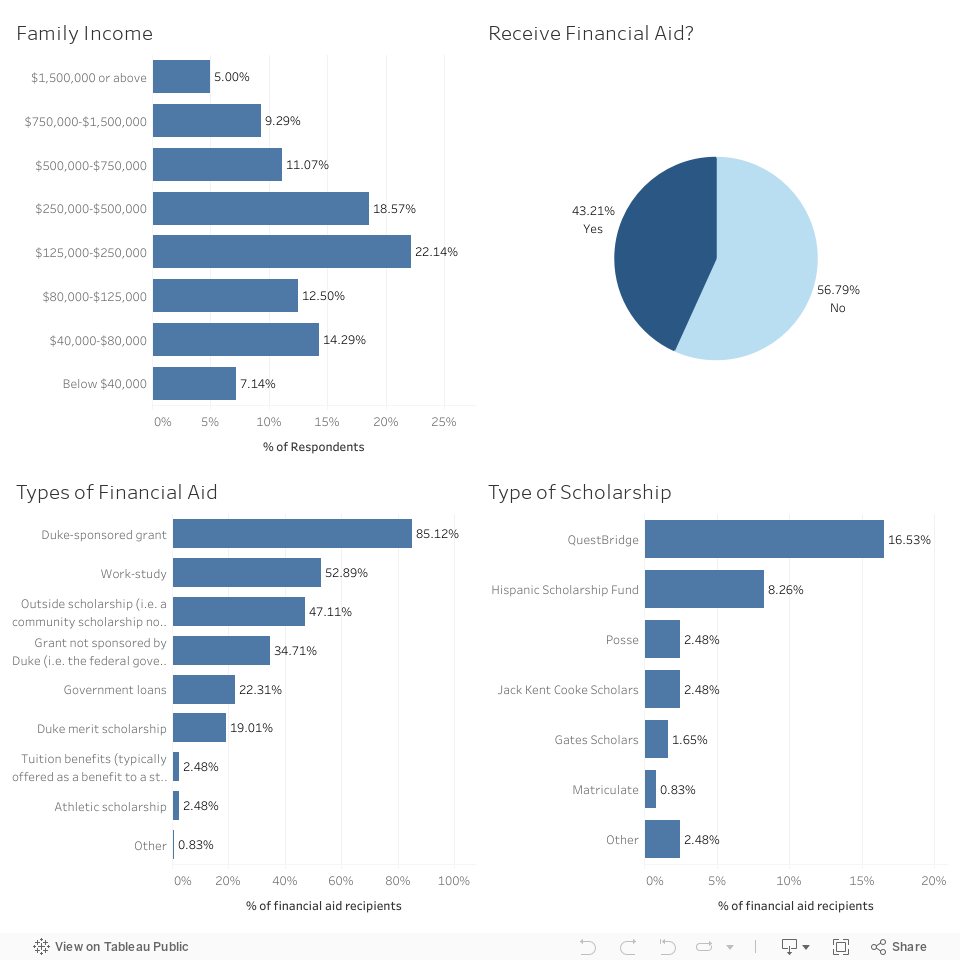
Regarding income level, 7.14% of respondents have income levels below $40,000, while 14.29% have family incomes between $40,000 and $80,000; 12.5% have family incomes between $80,000 and $125,000; 22.14% have family incomes between $125,000 and $250,000; 18.57% have family incomes between $250,000 and $500,000; 11.07% have family incomes between $500,000 and $750,000; 9.29% have family incomes between $750,000 and $1,500,000; and 5% have family incomes over $1,500,000.
43.21% of respondents said they received financial aid. This year, respondents could also identify what types of financial aid they receive. 85.12% of respondents who receive financial aid receive a Duke-sponsored grant. 52.89% receive a work-study, 47.11% receive an outside scholarship, 34.71% receive grants not sponsored by Duke, 22.31% receive government loans, 19.01% receive a Duke merit scholarship, 2.48% receive tuition benefits, which are typically offered as a benefit to a student's parent by their employer, 2.48% receive an athletic scholarship and .83% receive “other” forms of financial aid. Respondents could select multiple sources of financial aid.
Price wrote that the number of students who are Pell Grant-eligible at Duke has grown “quite significantly this year, to approximately 17%” for the Class of 2027.
16.53% of respondents who receive financial aid received a QuestBridge scholarship, 8.26% receive aid from the Hispanic Scholarship Fund, 2.48% are Jack Kent Cooke Scholars, 1.65% are Gates Scholars, 0.83% receive aid from Matriculate and 0.83% receive “other” outside scholarships.
Paths to Duke
Students varied in their paths to Duke. The survey asked the Class of 2027 if they applied early decision, whether Duke was their first choice, whether they have legacy status, the type of high school they came from, whether they took a gap year and why they chose Duke.
Domestic Students
International students
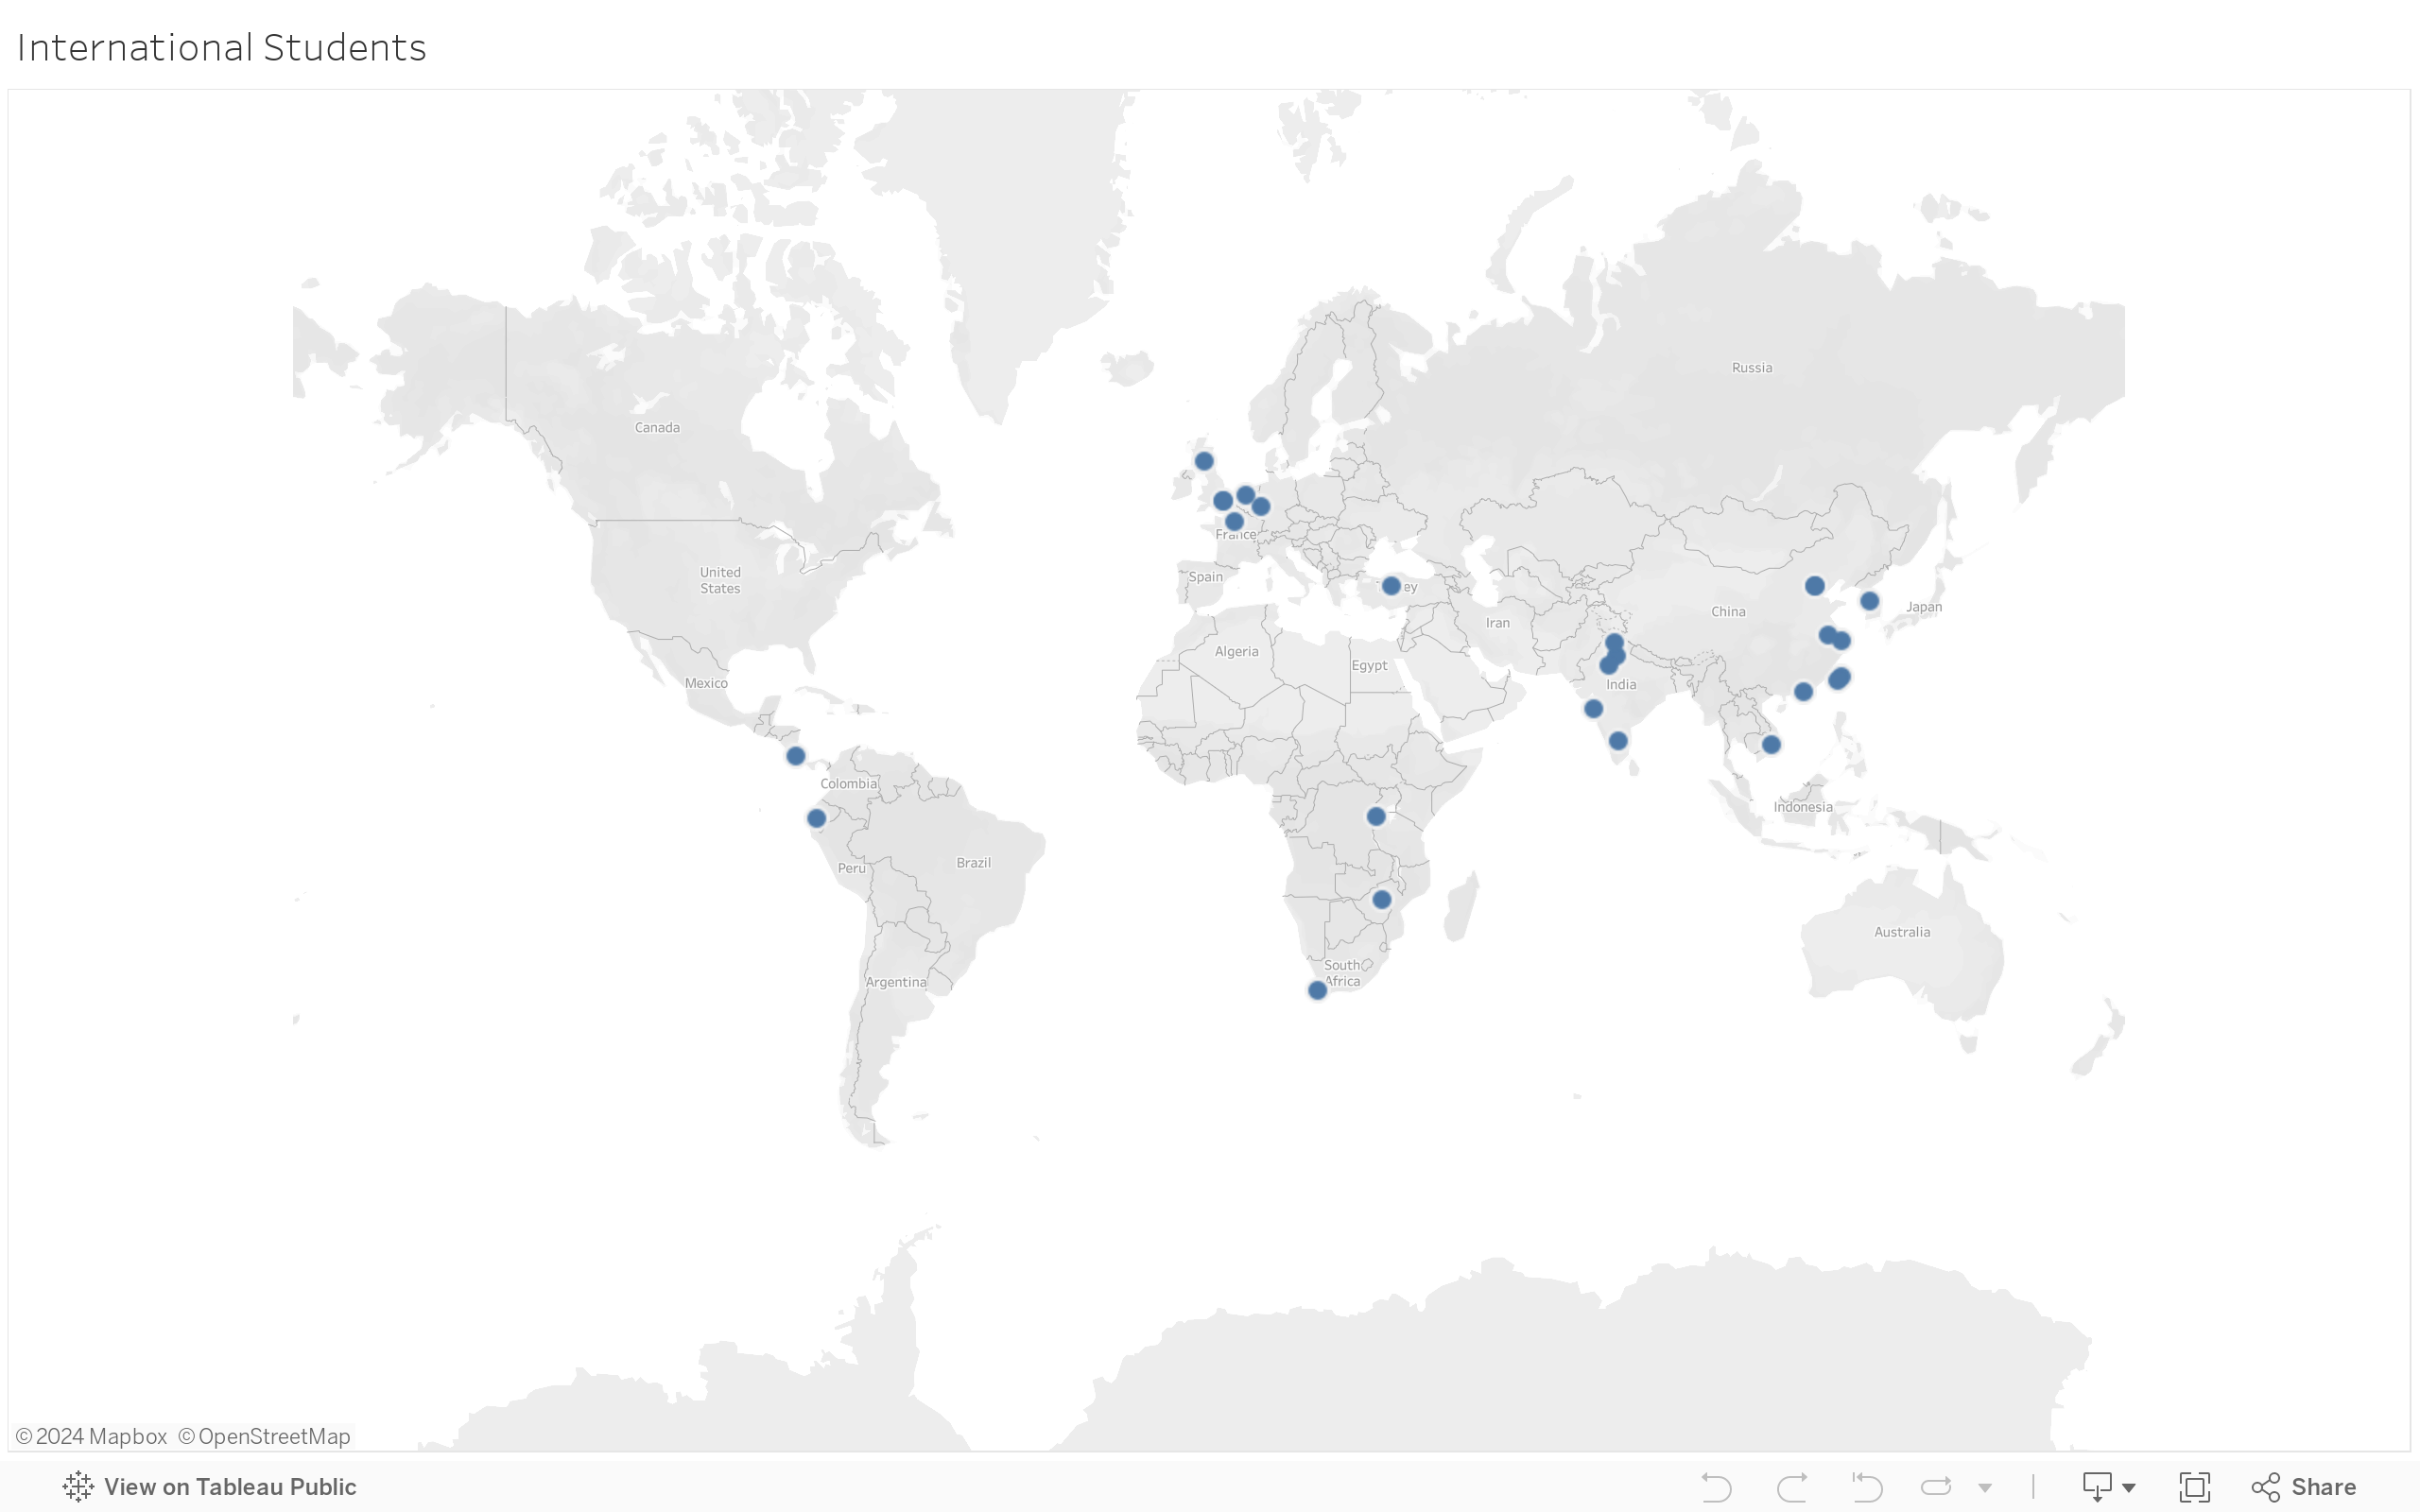
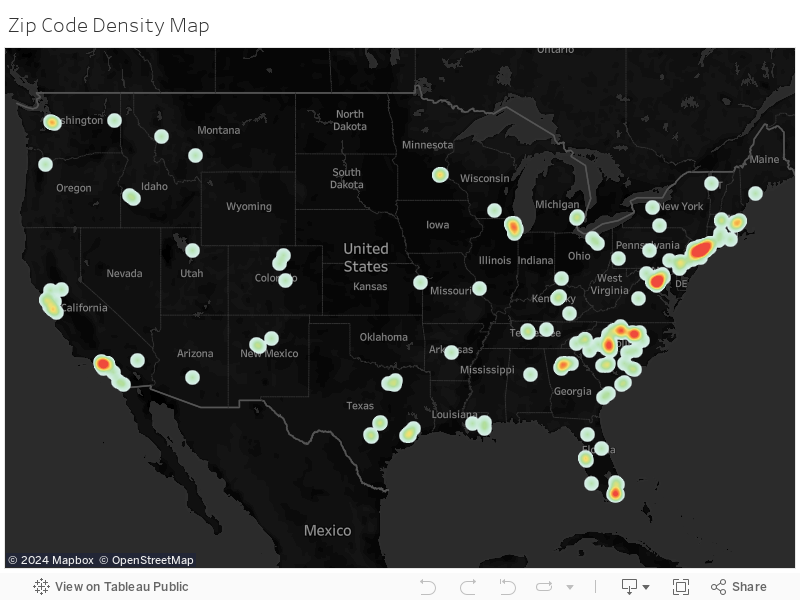
The top five states from which domestic students came were North Carolina (17.7%), California (11.52%), New York (6.58%), Florida (6.58%) and South Carolina (5.35%). The top five countries outside of the United States were India, China, Taiwan, France and Canada.
According to official Duke data, the top five states of the entire undergraduate population are North Carolina, New York, California, Florida and New Jersey. The top five countries are China, India, South Korea, the United Kingdom and Canada.
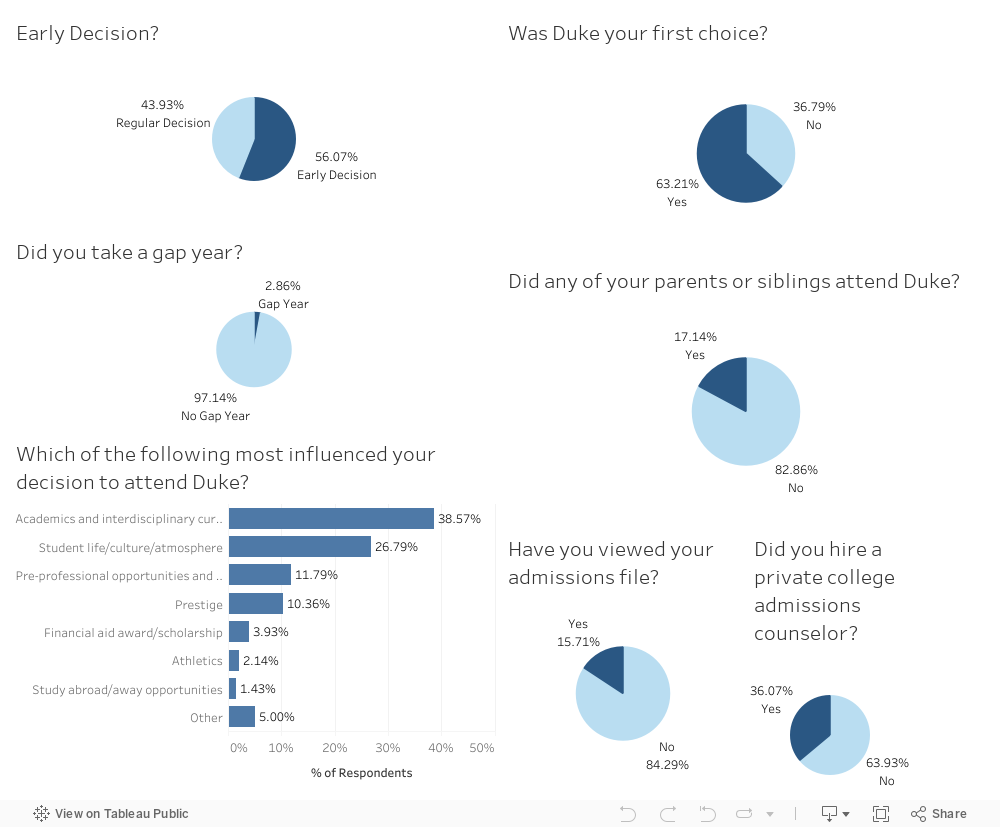
56.07% of respondents applied early decision, and 63.21% said Duke was their first choice. Less than 3% of students took a gap year — about 63% of gap year students were originally part of the Class of 2023 or earlier, 12.5% were part of the Class of 2024 and 25% were part of the Class of 2025. 36% of students hired college admissions counselors. The most common reasons for choosing Duke were academics and interdisciplinary curriculum, as well as its student life, culture and atmosphere. More than 17% of respondents said their parents or siblings attended Duke.
This year, we asked if students had viewed their admissions file. 15.71% of respondents at the time of taking the survey had viewed their file. Out of those who had not yet viewed their file, 78% were planning on viewing it.
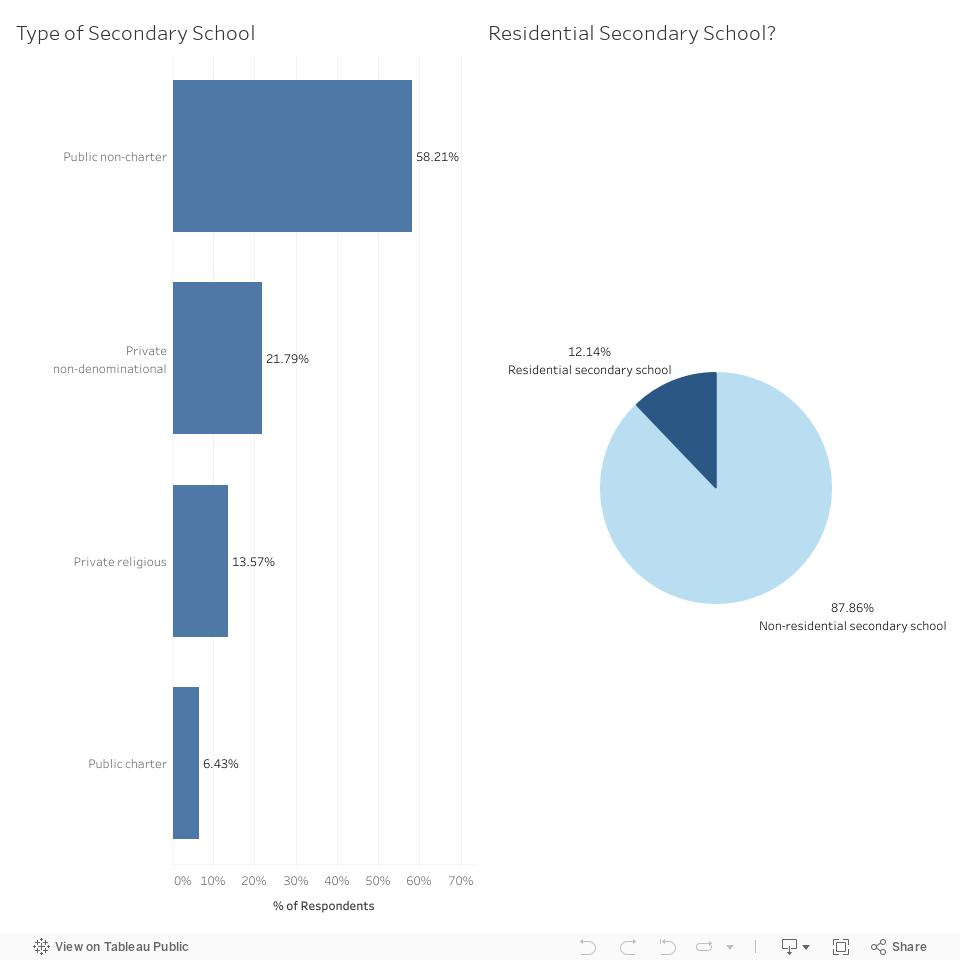
A majority of respondents (58.21%) attended public non-charter high schools. Additionally, 21.79% of respondents attended private non-denominational high schools, 13.57% attended private religious schools and 6.43% attended public charter schools. About 12.14% of respondents went to residential schools.
Life at Duke
The survey asked first-years to tell us what they plan to major in, their use of generative artificial intelligence, their interest in Greek life, selective living groups and living learning communities and their opinions on QuadEx.
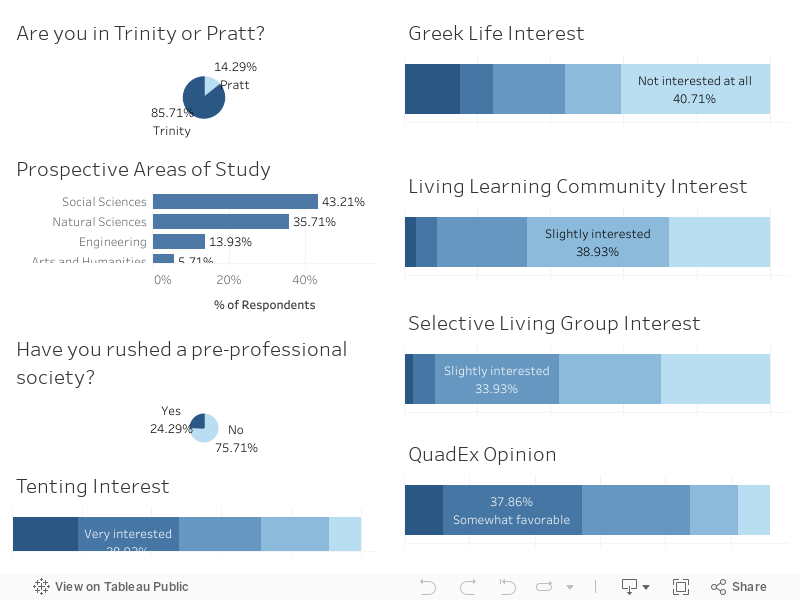
About 86% of respondents are in Trinity. Although 14% of respondents are in Pratt, a little less than 14% of respondents said they wanted to study engineering because they were interested in Trinity majors. Additionally, 43.21% of respondents plan to study the social sciences, 35.71% plan to study the natural sciences, 5.71% said the arts and humanities and 1.43% said either a Program II or IDM.
The top ten intended majors are economics, public policy, biology, computer science, biomedical engineering, psychology, neuroscience, political science, mathematics and mechanical engineering. Also, about a quarter of respondents rushed a pre-professional society.
About 20% of respondents were “extremely interested” in tenting, while a third were “very interested,” 23.57% were “moderately interested,” about 20% were “slightly interested” and about 9% were “not interested at all.”
Similar to the Class of 2026, about 41% of respondents said they had no interest in joining Greek life. 35% were “slightly” or “moderately” interested and about 24% were “very” or “extremely” interested.
27.5% of respondents said they had no interest in joining a living-learning community. About 39% said they were slightly interested, 24.64% said they were moderately interested and about 9% were “very” or “extremely” interested.
Regarding selective living groups, a similar proportion of respondents had no interest — 29.64% of students said they had no interest in joining a selective living group. 27.86% of respondents said they were not interested in joining selective living groups, 33.93% said they were “slightly” or “moderately” interested and 8.57% said they were “very” or “extremely” interested.
Almost half of respondents (48.57%) had “somewhat” or “strongly” favorable opinions of QuadEx, which is about a 7.6 percentage point increase from last year. About a third were neutral. While over a quarter of last year’s respondents had “somewhat” or “strongly” unfavorable opinions of the system, less than a quarter of this year’s respondents did (21.78%).
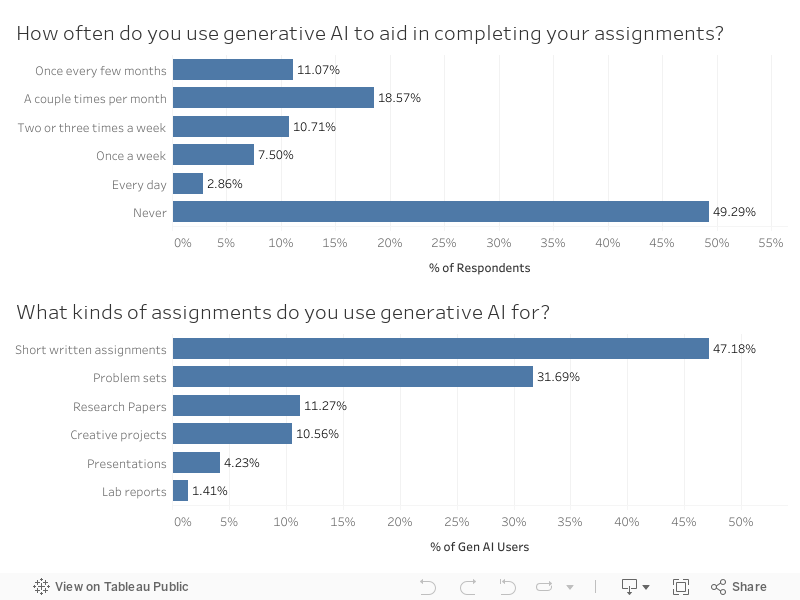
This year, we asked students how often they used generative artificial intelligence to aid in completing their assignments, as well as what assignments they used generative AI for. Fewer than half of respondents stated they never use this technology to complete their assignments. Over half of respondents stated that they use generative AI at least a couple of times per month, with a little less than 3% using it every day.
Out of the students who use generative AI, 47.18% use it for short written assignments such as blog posts and short essays. A third use it for problem sets, 11.27% use it for research papers, 10.56% for creative projects such as visual art and music composition, 4.23% use it for presentations and 1.41% use it for lab reports. Students could select multiple answer choices.
Lifestyle
We asked the Class of 2027 to tell us about their beliefs and lifestyles — from religion to drug use to their political beliefs and voting behaviors.
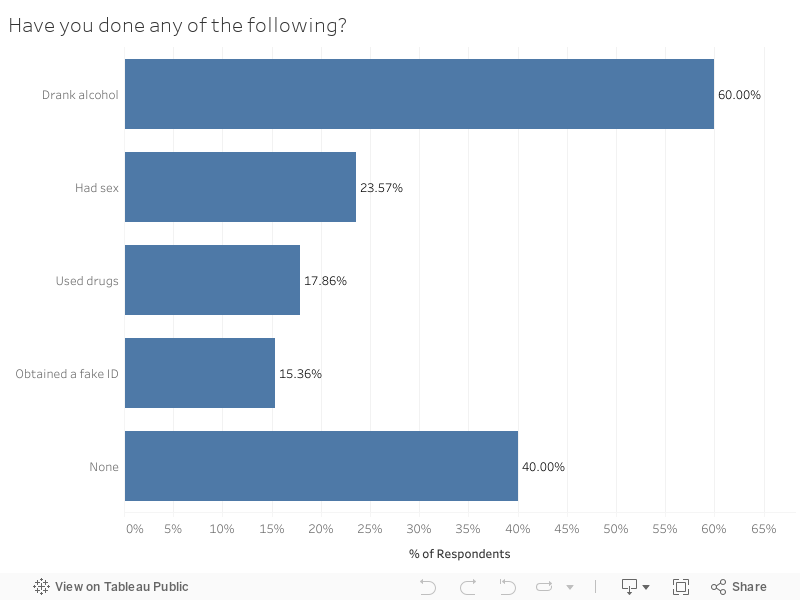
60% of respondents have drank alcohol, 23.57% have had sex, 17.86% have obtained a fake ID and 15.36% have used drugs. 40% of respondents have done none of these. Students could select multiple activities.
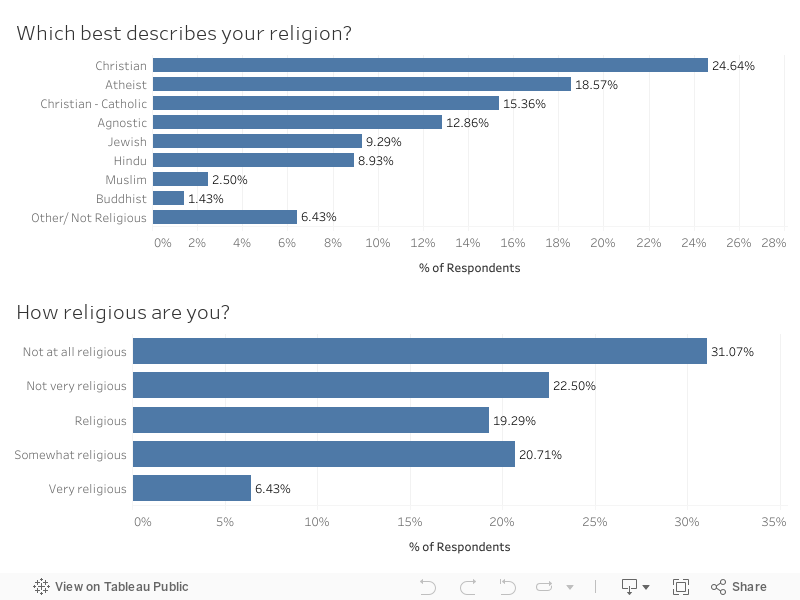
Regarding religion, about a quarter of students observe Christianity. 15% of students are Catholic. About 19% of respondents are atheists, while 13% are agnostic. 9% are Jewish, 9% are Hindu, 2.5% are Muslim and 1.4% are Buddhist. About 6% of students said they observed another religion not listed or did not observe any religion.
While a variety of religions were represented in The Chronicle’s survey, over 50% of students said they were not very religious or were not religious at all. 40% said they were “religious” or “somewhat religious,” and only about 6% said they were “very” religious.
COVID-19
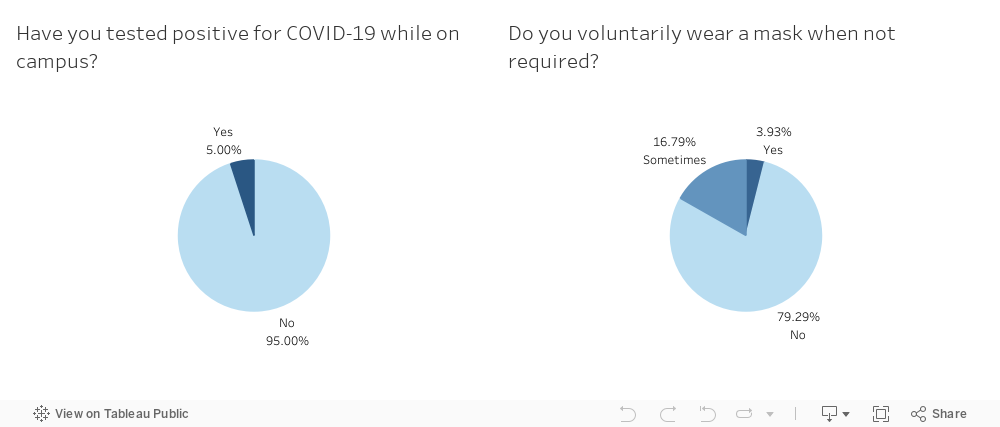
The COVID-19 pandemic had a small impact on campus for the Class of 2027. At the time that the survey was open, only 5% of respondents tested positive for COVID-19 on campus. About 80% of respondents do not voluntarily wear a mask when not required, while about 17% sometimes do and about 4% always do.
Voting
We asked students to share their political beliefs, where they plan to vote and whether they voted in the recent midterm elections.
About 58% of students said they were “somewhat” or “very” liberal, while 27.5% identified as moderates and 14.3% identified as “somewhat” conservative or conservative. This was a large difference from last year’s respondents, where nearly 72% of students said they were “somewhat” or “very” liberal, while 18% identified as moderates and nearly 10% identified as “somewhat” conservative or conservative.
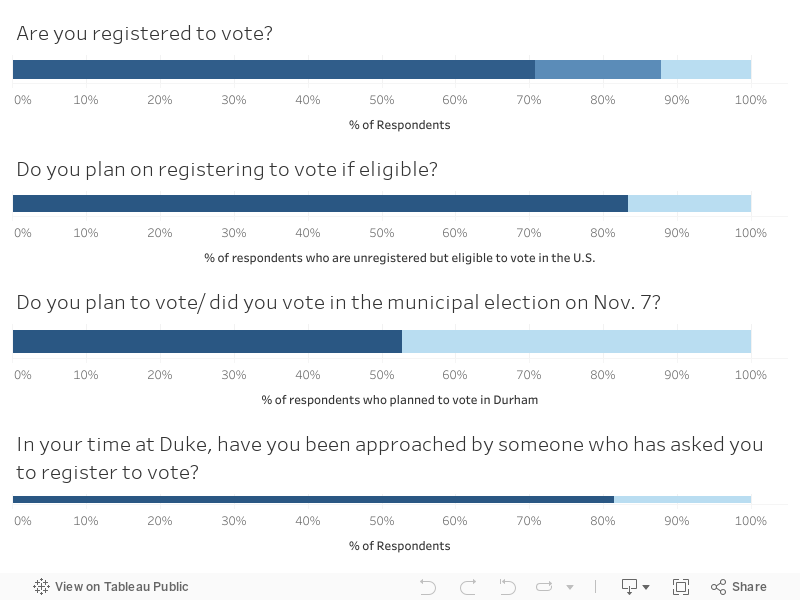
While 80% of students said they were registered to vote in the United States last year, just over 70% of students said they were registered this year. 17% said they were ineligible. About 83% said they planned on registering to vote if they were eligible.
52.8% of respondents voted or planned to vote in the municipal election at the time of their response. 81.43% of students said they had been asked about their voter registration status while at Duke.
Mia Penner contributed data analysis.
Get The Chronicle straight to your inbox
Signup for our weekly newsletter. Cancel at any time.

Katie Tan is a Trinity senior and digital strategy director of The Chronicle's 119th volume. She was previously managing editor for Volume 118.