Editor's note: This story is part of a series about the Class of 2026 based on a survey conducted by The Chronicle. You can read more about our methodology and limitations here, or see all of our survey coverage here.
We asked the Class of 2026 to tell us about their beliefs, lifestyle, choices and attitudes towards COVID-19 — from religion to drug use to whether they have sought mental health treatment before.
About half of students have drunk alcohol, 16% have had sex, 12% have obtained a fake ID, and 21% have used drugs. Over a quarter of students have received mental health treatment before, with about 13% of students currently receiving treatment.
Religion
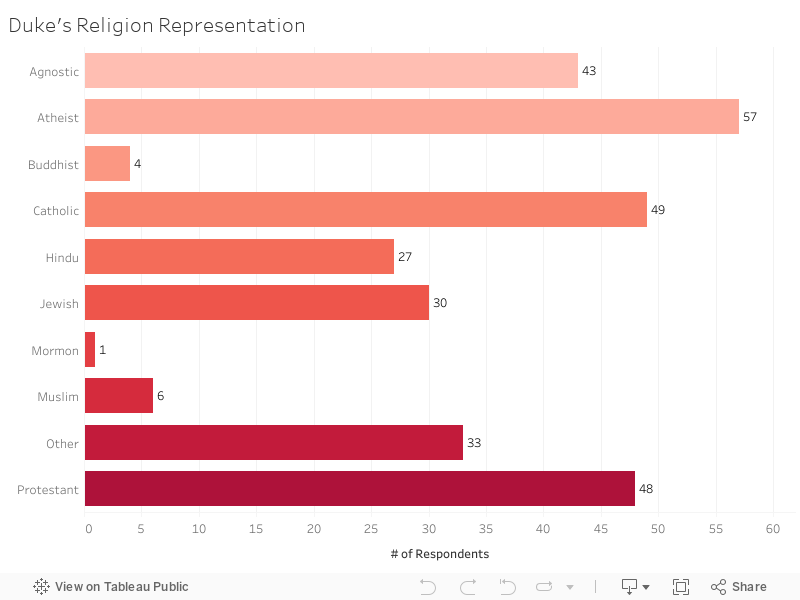
About one-third of students observe Christianity, with Catholic and Protestant students equally represented. Almost one in five students were atheists, and about one in 10 students were either Jewish or Hindu. 2% of respondents were Muslim, 1.34% were Buddhist and less than 1% were Mormon. About 11% of students said they observed another religion not listed.
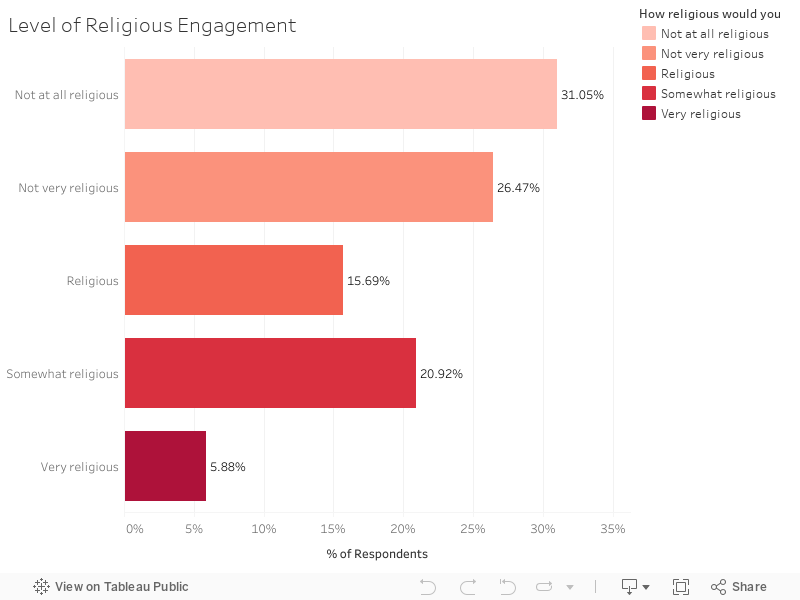
While a variety of religions were represented in The Chronicle’s survey, over 50% of students said they were not very religious or were not religious at all. One in five said they were “somewhat” religious, and only 6% said they were “very” religious.
About 60% of students do not attend religious services at Duke, while 17.5% attend services at least once a week and the remainder attend services at least once a month or on special occasions.
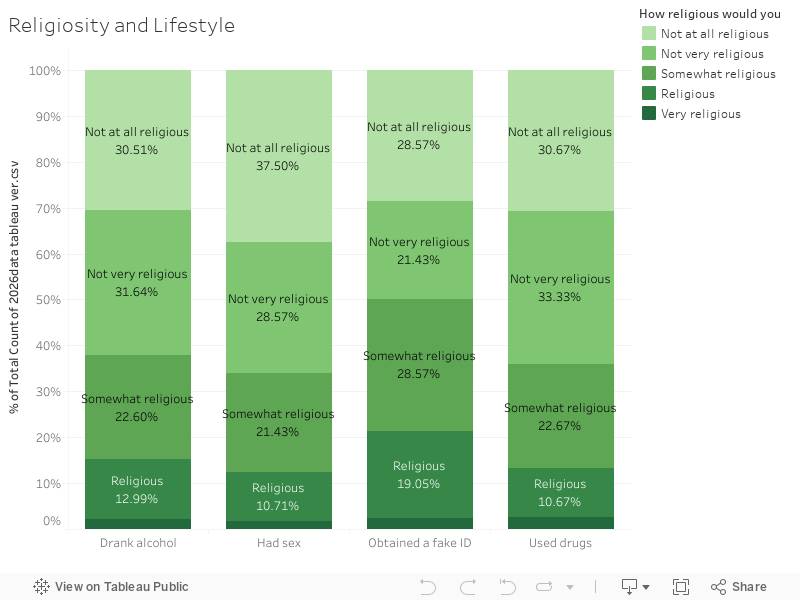
Students who considered themselves religious or very religious were less likely to drink alcohol, have sex, obtain a fake ID or use drugs than those who were somewhat religious, not very religious, or not at all religious.
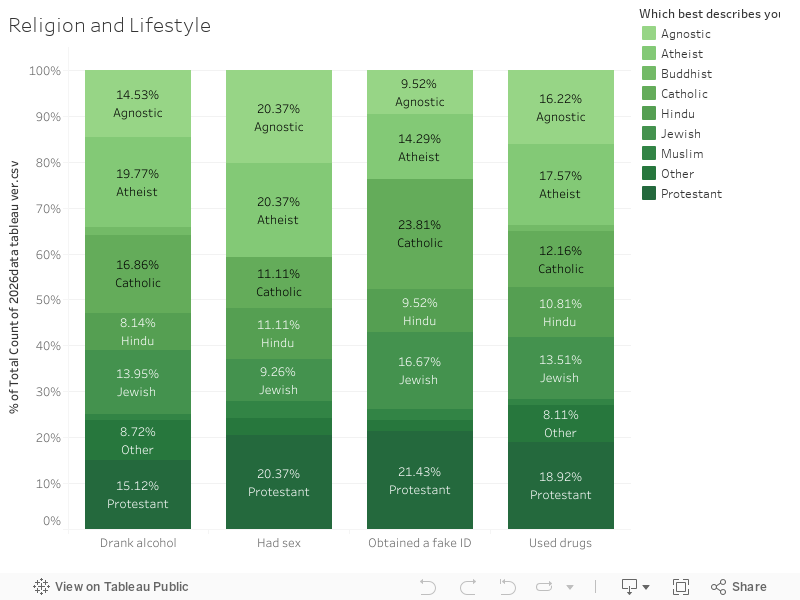
Catholic students were the largest proportion of students to have obtained a fake ID (23.8%), while Protestants were the largest proportion of students to have used drugs (18.9%). Equal proportions of Protestant, atheist and agnostic students have had sex (20.4%). Atheists were the largest proportion of students to drink alcohol (19.77%). Muslim and Buddhist students were least likely to partake in any of the specified activities.
Political Leanings
Political Leanings & Religion
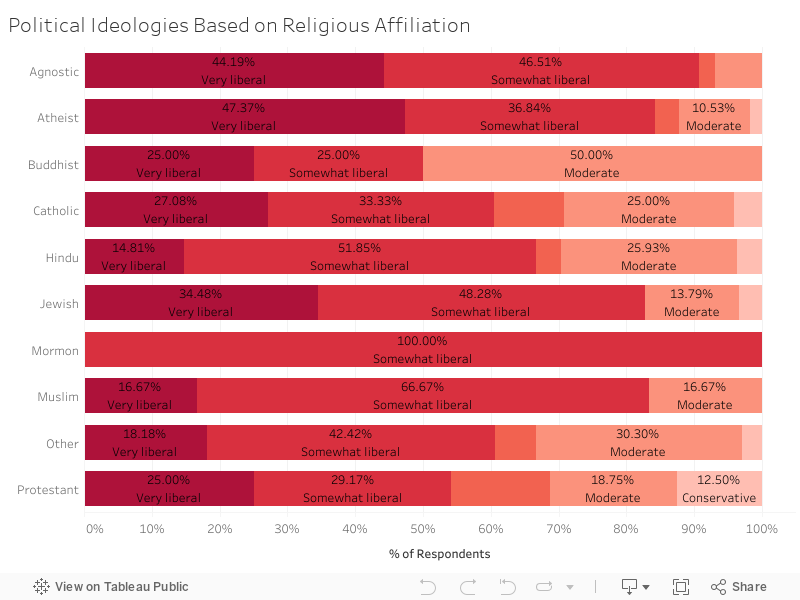
Agnostic and atheist students are more likely to be somewhat liberal to liberal.
25% of Protestants that responded were liberal, and nearly 30% were somewhat liberal.
Those that are Hindu tend to be more moderate: only 14% identified as liberal, and 3% identified as conservative. 51.84% identified as somewhat liberal, and 25.97% identified as moderate.
Catholics tend to identify as moderate to liberal; 14% identified between both conservative and somewhat conservative, but 58% identified as liberal to somewhat liberal.
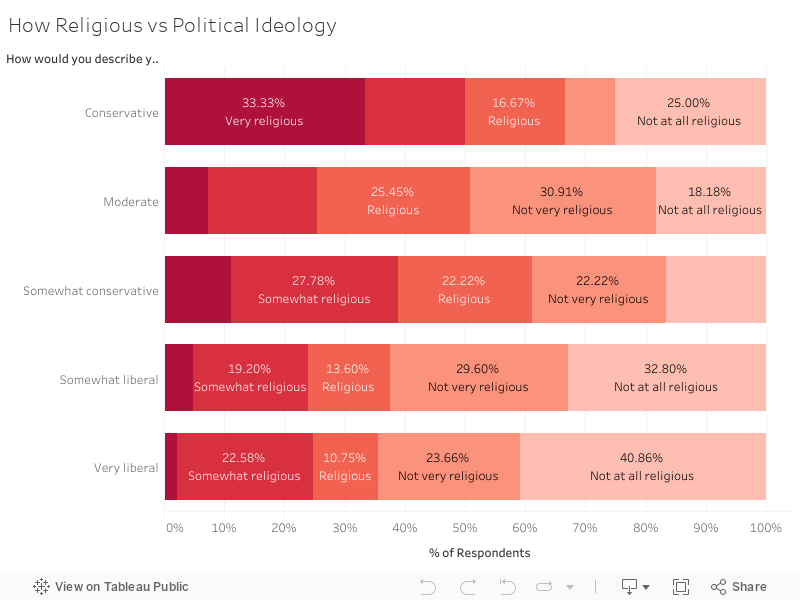
50% of conservative students reported being very or somewhat religious. 25.45% of moderate students reported being very or somewhat religious as compared to 22.58% of students who identified as very liberal.
Political Leanings & Political Action
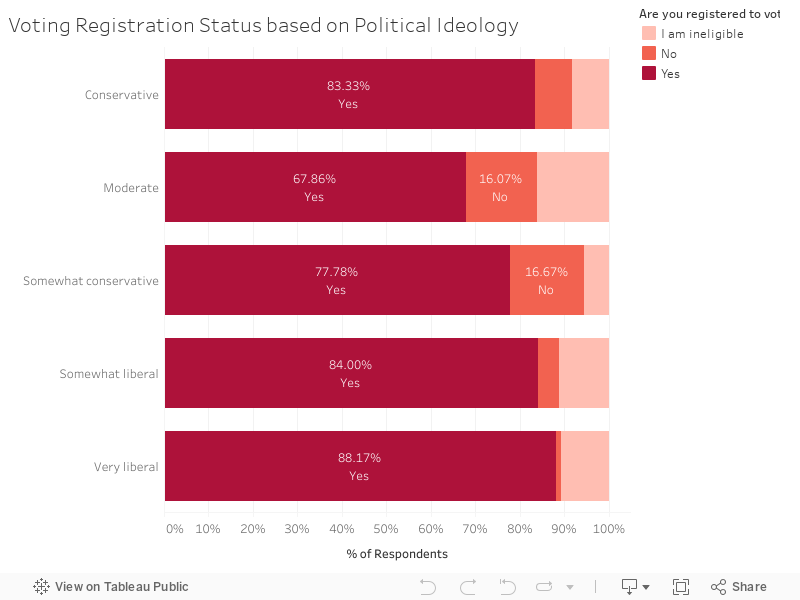
At Duke, the more extreme the political ideology affiliation, the more likely one is to be registered to vote.
88.30% of students who identified as very liberal were registered to vote, and 83.33% of students who identified as conservative were registered to vote. 69.49% of students who identified as moderate were registered to vote.
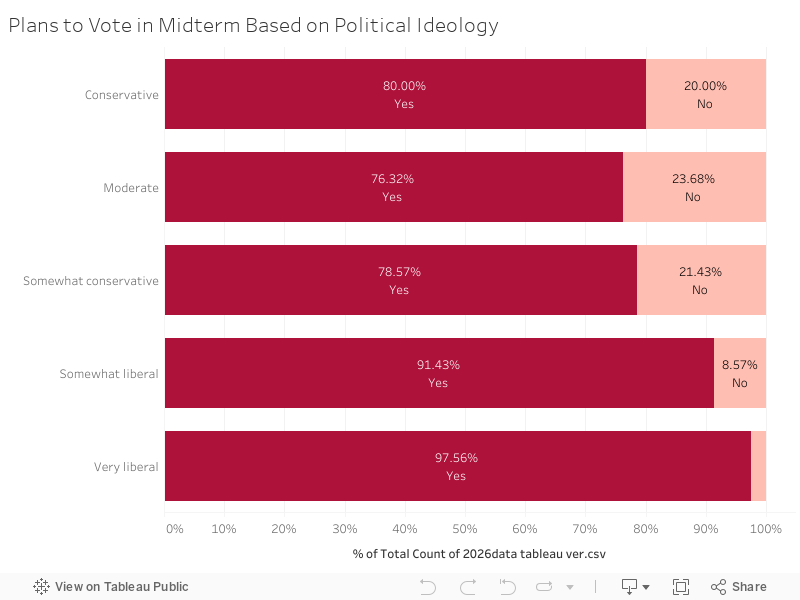
Students who identified as very liberal or somewhat liberal were more likely to vote in the midterm elections.
97.59% of those who identified as very liberal and 90.65% of those who identified as somewhat liberal answered yes when asked if they planned on voting in the midterm elections. 80% of students who identified as conservative planned on voting in the midterm elections compared to 75.61% of students who identified as moderate.
Attitudes toward COVID-19
The Class of 2026 entered a campus less impacted by the pandemic than the two prior classes.
The survey asked respondents whether they chose to voluntarily wear masks in the classroom. 17.65% selected yes to wearing masks voluntarily. Among immunocompromised respondents, 9.09% wore masks voluntarily in the classroom, while only 12.5% of respondents with disabilities voluntarily wore masks in the classroom.
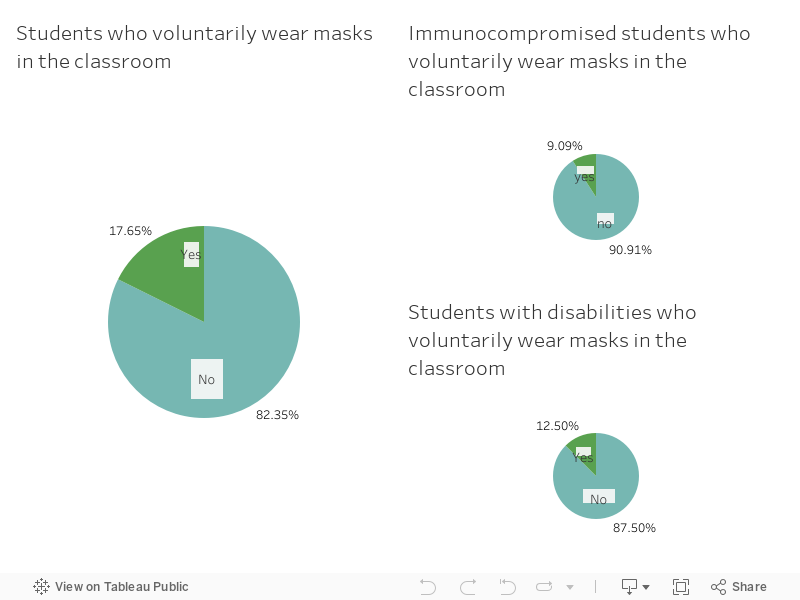
3.6% of respondents identified as immunocompromised and 2.5% as disabled in the demographics section of the survey.
The survey further allowed students to select which masks they used on-campus, options including cloth masks, surgical masks, KN95 masks and N95 masks.
Surgical masks were most popular among respondents, with 80% of all respondents using them. Next were cloth masks at 46%. Only 27% of respondents used KN95 masks and 19% N95. Among students with disabilities, 87.5% used surgical masks. Cloth, N95 and KN95 masks were all used by 37.5% of respondents. Among immunocompromised students, 82% used surgical masks, 45.5% cloth, 18% KN95 and 0% N95.
Nadia Bey contributed data analysis.
Get The Chronicle straight to your inbox
Signup for our weekly newsletter. Cancel at any time.

Sana Pashankar is a Trinity senior and a staff reporter of The Chronicle's 118th volume.

Ayra Charania is a Trinity junior and a senior editor of The Chronicle's 118th volume.

Olivia Kim is a Trinity first-year and a staff reporter of The Chronicle's 118th volume.