For the second year, The Chronicle has fielded a survey for the first-year class, asking questions about the Class of 2022’s demographics, beliefs, lifestyles and plans for their time at Duke.
In the survey, The Chronicle asked first-years a wide range of questions to get an in-depth look at the lives of the new Duke students. Unlike last year's survey, this year’s also asked whether Duke should make standardized testing scores optional.
The survey gave a detailed look into the academic, personal, social and political backgrounds of the Class of 2022, with questions asking anything from their high-school test scores to their alcohol and drug use. The students also revealed how they would like to spend their next four years at Duke—from which majors they were pursuing, to which color they wanted to tent for basketball games.
The month-long survey was posted on the class’ Facebook page in July, with prizes for random participants. Overall, 259 first-years—about 15 percent of the class—took the survey, but not everyone who participated answered each question.
Last year, Jerry Reiter, professor of statistical science, said that the students’ reason for opting out could be more problematic than the low response rate. Lack of access to the survey or low enthusiasm for Duke could make the results unrepresentative of the class, he said.
But just as many students may have chosen not to complete the 30-question survey due to time constraints—which would not change the results dramatically.
The Chronicle will release survey results in their entirety online on Tuesday, with comparisons of groups throughout the week and fully in print Oct. 22. But before publication, we have presented some different demographics where the survey reflects the Class of 2022 profile—which was released by the Office of Undergraduate Admissions—and others where it does not. Where the two datasets disagree, you can decide for yourself whether the data is skewed.
Race and ethnicity
The Chronicle’s survey participants were under-representative of a typical year in terms of race and ethnicity in two major categories. While 10 percent of the Class of 2022 is black and 11 percent is Hispanic, only 6 percent and 5 percent of the respondents identified in that way, respectively. In contrast, Duke’s class profile lists only 28 percent of the class as Asian or Asian-American, but Asian-American students made up 38 percent of those who took the survey.
However, the survey was on par in its representation of white students.
One potential reason for these discrepancies was that, unlike the admissions office’s tally, The Chronicle’s survey included “other” as an option—which was chosen by about 6 percent of respondents.
The survey was fairly representative of international students in the freshmen class. About 11 percent of survey participants indicated being international, and 11.5 percent of the Class of 2022 hails from outside the United States.
Socioeconomic diversity
The Chronicle’s survey asked participants to estimate their immediate family’s total annual income in ranges. Although the University does not release information about annual family income of students, The New York Times released data about Duke’s socioeconomic diversity in 2016.
Although The Times used different metrics to classify the data it reported, The Chronicle performed a cursory comparison between its own data and The Times’. The survey responses were largely an overrepresentation of students with family incomes in the Top 20 percent—but mostly matched the income ratios for those in the Bottom 80 percent, as reported by The Times.
Academics
Like last year, The Chronicle’s survey overrepresented the fraction of students that attended public high schools. About 71 percent of survey participants said they went to public school, but, according to the admissions office report, only about 65 percent of the Class of 2022 did.
The Chronicle’s survey was also slightly over-representative of students who applied through regular decision. About half of first-years were regular-decision applicants, according to the admissions office report. In The Chronicle’s survey, almost 57 percent said they applied regular decision.
Duke’s official Class of 2022 profile indicated that a little more than 19 percent of enrolled students are in the Pratt School of Engineering. Likewise, just under 19 percent of survey respondents are in Pratt.
Geographic distribution
U.S. Geographic Distribution of Chronicle Survey Participants:
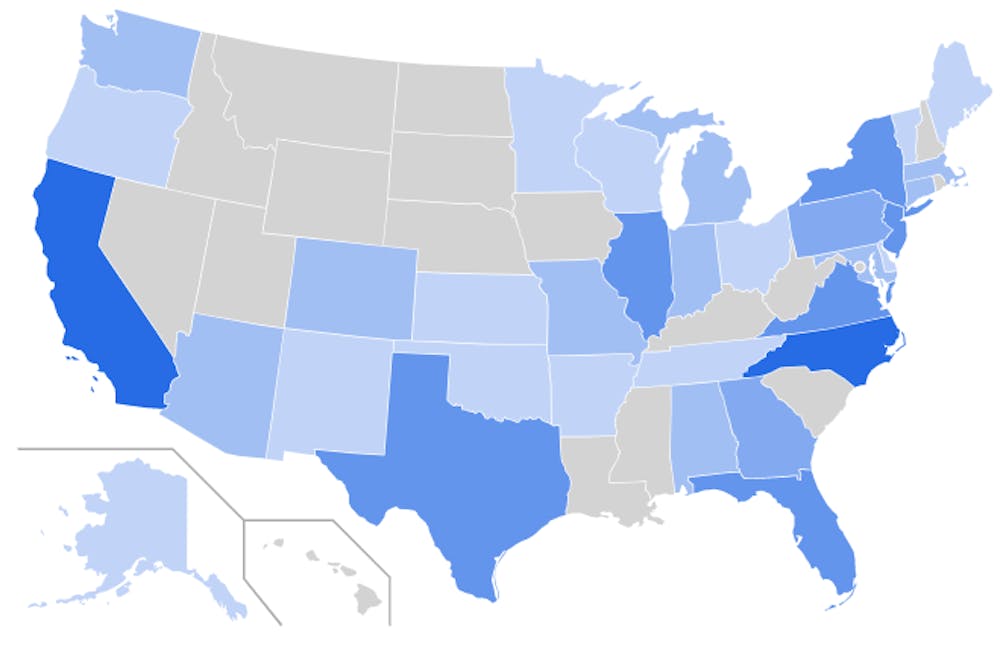
The Chronicle’s survey included a similar proportion of students as the Class of 2022 profile in 10 states, including Alabama, Arizona, Colorado, Connecticut, Delaware, Florida, Kansas, Pennsylvania, Tennessee and Texas.
States that were underrepresented in the survey included Ohio, Maryland, New York and Massachusetts.
However, there were 13 states which, according to survey results, boasted no first-year students. Most of these states were either located in the West, such as Idaho and Utah, or the South, such as Louisiana and Mississippi.
Also, Montana, North Dakota, West Virginia and Wyoming all had no Class of 2022 students or survey respondents.
Get The Chronicle straight to your inbox
Signup for our weekly newsletter. Cancel at any time.
Class of 2019
Editor-in-chief 2017-18,
Local and national news department head 2016-17
Born in Hyderabad, India, Likhitha Butchireddygari moved to Baltimore at a young age. She is pursuing a Program II major entitled "Digital Democracy and Data" about the future of the American democracy.