Editor's note: This story is part of a series about the Class of 2026 based on a survey conducted by The Chronicle. You can read more about our methodology and limitations here, or read all of our survey coverage here.
Students varied in their paths to Duke. The survey asked the Class of 2026 if they applied Early Decision, whether Duke was their first choice, whether they have legacy status, the type of high school they came from, whether they took a gap year and why they chose Duke.
The top five states from which students came were North Carolina (15%), California (11%), Texas (8%), New York (7%) and Florida (6%). The top five countries outside of the United States were India, China, Brazil, South Korea and the United Arab Emirates.
As for the type of community students grew up in, 69.32% of students came from suburban communities, 7.69% of students came from rural communities, and 22.79% of students came from urban communities.
While only 53% applied early decision, 63% said Duke was their first choice. Less than 3% of students took a gap year, with those students originally being admitted to the Class of 2025. About 30% of students hired college admissions counselors. The most common reason for choosing Duke was academics and interdisciplinary curriculum. About 15% of students said their parents or siblings attended Duke.
A majority of students (58%) attended public non-charter high schools. Additionally, a quarter of students attended private non-denominational high schools, 11% attended private religious schools and 5% attended public charter schools. About one in ten students went to residential schools.
Comparing income, community and background of students
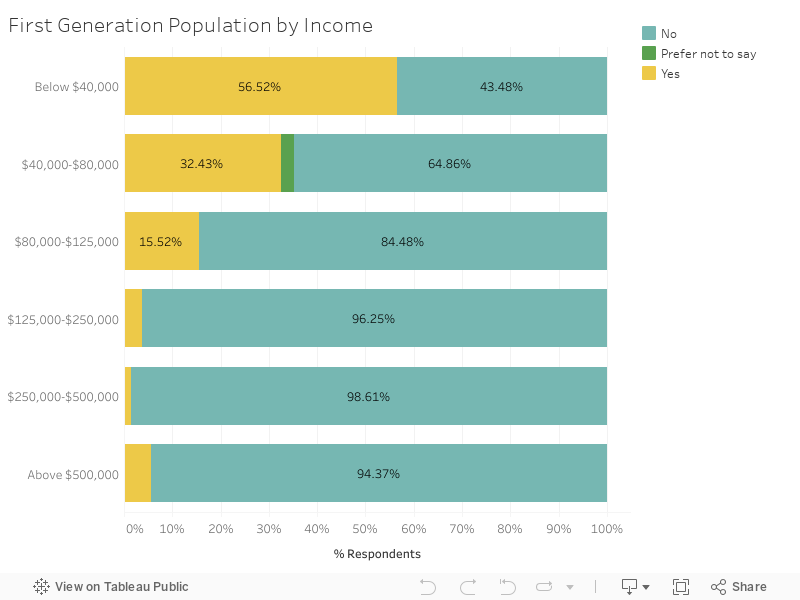
First-generation students were more likely to belong to lower-income categories than non first-generation students.
56.5% of students who had a household income of below $40,000, which was the lowest reported family household income category, reported being first-generation. In the highest reported income category, which was above $500,000, only 5.6% of students were first-generation.
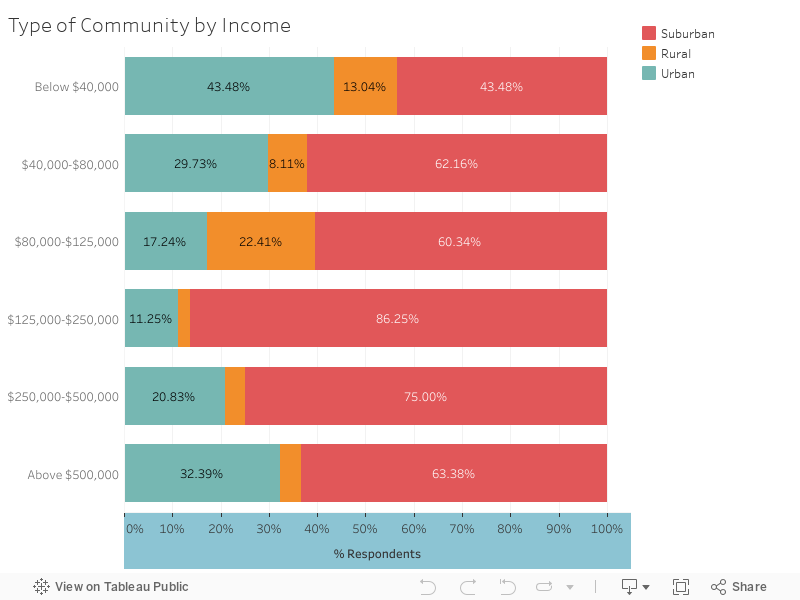
Across all income categories, students mainly come from suburban communities.
Across all income categories, the majority or an equal proportion of students reported coming from suburban communities as compared to rural or urban communities.
Students on opposite ends of the income ladder came from urban communities.
In the lowest family household income category, below $40,000, 43.5% of students reported belonging to urban communities, the highest proportion out of any income category. In the highest family household income category, above $500,000, 32.39% of students reported belonging to urban communities, the second highest proportion out of any income category.
Application process
We also assessed aspects of students’ application process to Duke, including test-optional policies and the variety of other colleges applied to.
Students applied to between one and 31 schools and received between one and 22 acceptances. The average number of schools applied to were 11, and the average number of acceptances was five.
Although 80.88% of students reported that Duke’s test optional policy had no influence on their decision to apply, nearly one fifth, 19.54%, of students submitted neither the ACT or the SAT.
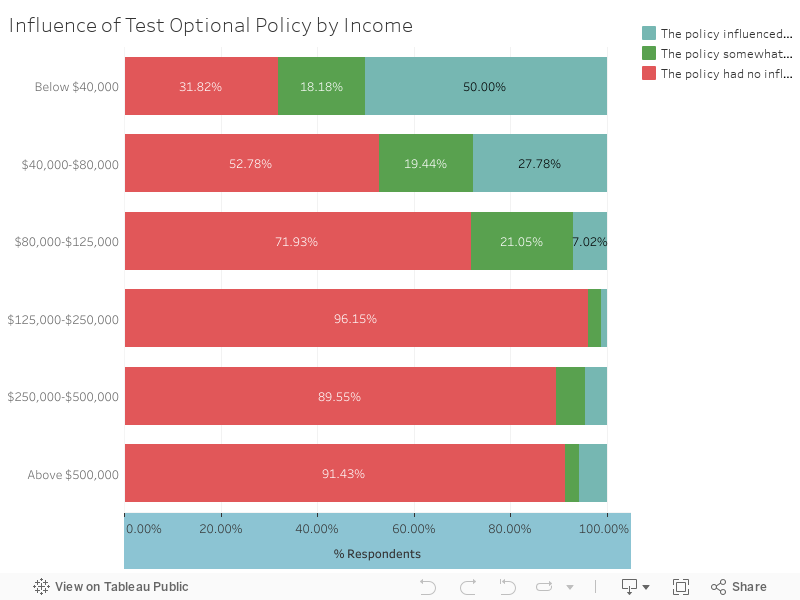
Test optional policies had a more significant influence on lower-income student’s decision to apply.
68.18% of students in the lowest income category, below $40,000, said that the test-optional policy influenced their decision either somewhat or significantly. On the other hand, 91.43% of students in the highest income category, above $500,000, said that the test-optional policy had no influence on their decision to apply to Duke.
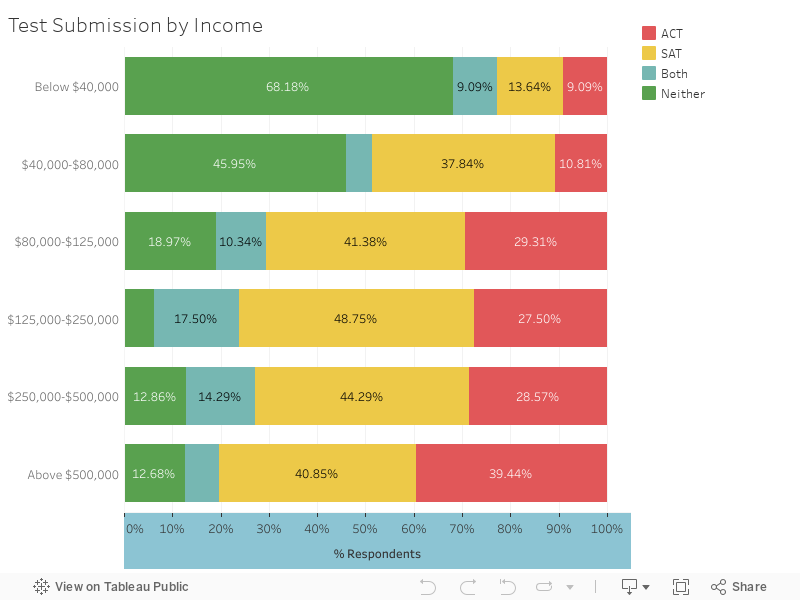
Lower-income students are less likely to submit standardized test scores.
68.2% of students in the lowest income category, below $40,000 submitted neither the SAT or the ACT, while only 12.7% of students in the highest income category, above $500,000, submitted neither. Likewise, 13.6% of students with family reported incomes under $40,000 submitted the SAT, and 9.09% of students submitted the ACT.
On the other hand, 40.9% of those in the top income category submitted the SAT, and 39.4% of these students submitted the ACT.
Gap years
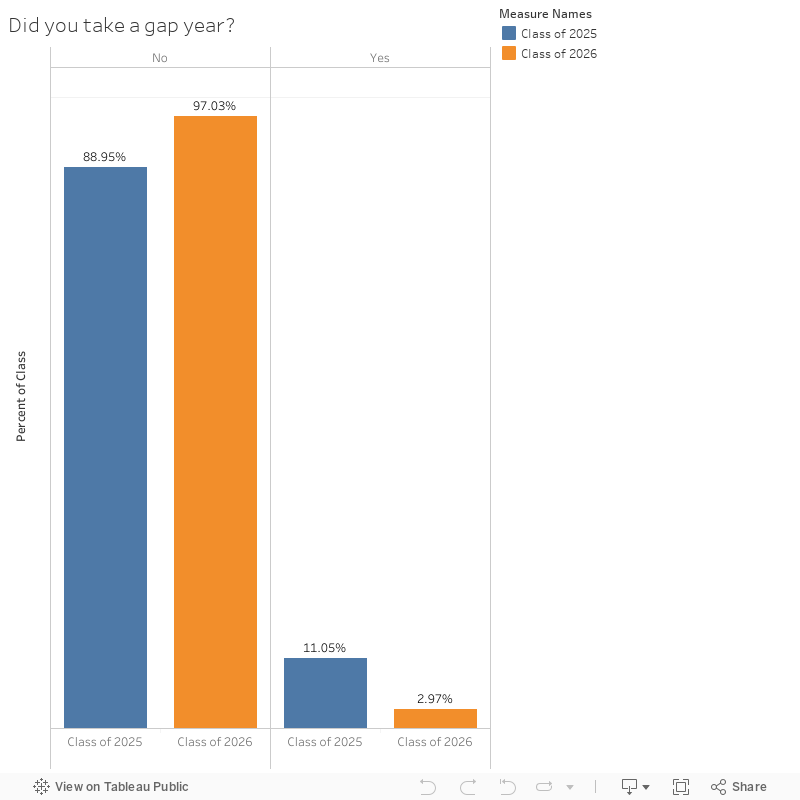
The Class of 2026 was less likely to take a gap year than the Class of 2025.
Nearly 3% of current first year students reported having taken a gap year compared to 11% in the Class of 2025.
Adway Wadekar and Katie Tan contributed data analysis.
Get The Chronicle straight to your inbox
Signup for our weekly newsletter. Cancel at any time.

Sana Pashankar is a Trinity senior and a staff reporter of The Chronicle's 118th volume.