Editor's note: This story is part of a series about the Class of 2024 based on a survey conducted by The Chronicle. You can read more about our methodology and limitations here, or see all of our survey coverage here.
The Class of 2024 described their political beliefs, voting plans, presidential votes and more in The Chronicle’s first-year survey.
Of the first-years surveyed, 92.3% voted or planned to vote for Joe Biden, while 7% voted or planned to vote for Donald Trump. Green Party Co-founder Howie Hawkins and Libertarian candidate Jo Jorgenson each received one vote from survey respondents.
More than 70% of first years identified themselves as somewhat liberal or very liberal—36.6% and 38%, respectively. Almost a fifth of students, 19.1%, described themselves as politically moderate. Somewhat-conservative students make up 5.4% of respondents. while very conservative students represent just 1%.
Participation in the 2020 general election was much greater than participation in primary elections among survey respondents. Of those eligible to vote in a primary election, 67.8% of students said they did. Of those students eligible to vote in the 2020 election, 99.6% of first-years either had voted or were planning to vote.
Slightly more students—about 54.5%—voted or planned to vote in North Carolina than in other states.
Who are Trump and Biden voters?
White, multiracial, Hispanic students more likely to vote for Trump
While the vast majority of all racial and ethnic groups voted for Biden, Hispanic and Latinx students were slightly more likely than non-Hispanic and Latinx students to have voted for Donald Trump—11.1% compared to 6.4%.
Non-Hispanic white and multiracial students were also among the most likely groups to have voted for Donald Trump—10.1% and 8.7%, respectively, compared to 1.2% Asian students and 0% Black or African American students in our survey.
A greater percentage of Duke students in every racial and ethnicity category voted for Biden than the national population. According to national exit polls published by the New York Times, 41% of white, 87% of Black, 65% of Hispanic and Latinx, 61% of Asian and 55% of other races voted for Biden.
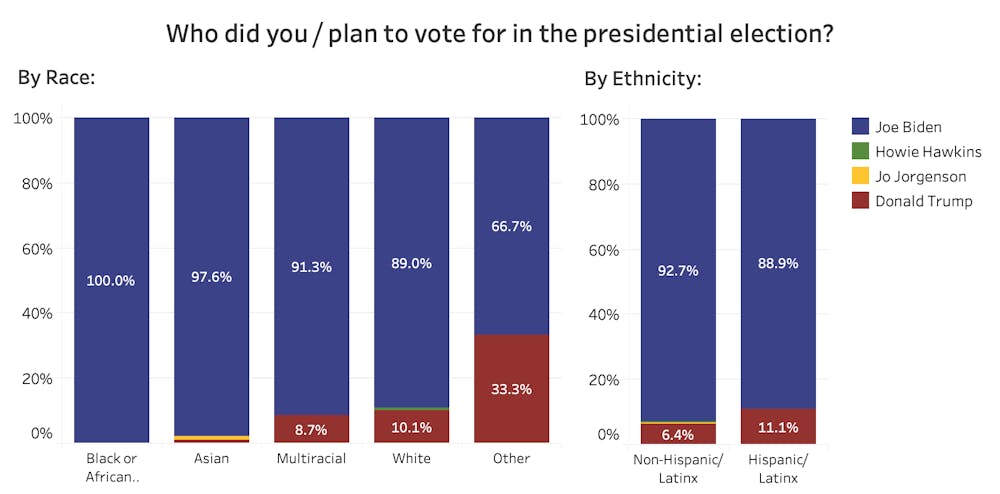
Note: The “American Indian or Alaska Native” category was excluded from analysis because it contained one student. There were only three students in the "Other" category.
Wealthier students more likely to vote for Trump
The highest income bracket—above $500,000—held the largest proportion of Trump voters with nearly 21% of respondents in that income level having voted for Trump.
Compared to 12.6% of Biden voters who come from the above $500,000 income bracket, almost half—42.1%—of Trump voters come from the same income bracket.
This pattern is consistent with nationwide trends. According to the New York Times polls, 55% of voters who earned less than $50,000 in 2019, 57% of voters who earned between $50,000 and $99,999 and 42% of voters who earned more than $100,000 voted for Biden.

Religious first-years more likely to vote for Trump
Over 60% of Biden voters identify themselves as “not at all religious” or “not very religious” while for Trump, that percentage is just below 40%. Similarly, students who voted for Trump are overwhelmingly identified with a religion as opposed to agnostic or atheist. Of those who voted for Trump, 42.1% are Catholic and 21.1% are Protestant.

Biden voters more likely to represent diverse sexual orientations, genders
About 25% of students who voted for Biden identify with a sexual orientation other than heterosexual, compared to approximately 10% of Trump voters.
Additionally, while the majority, 57.9% of Trump voters are cisgender men, the majority, 64.3%, of Biden voters are cisgender women. This is consistent with New York Times polls that showed the majority, 57%, of females voting for Biden and the majority, 53%, of men voting for Trump.
Biden voters also consisted of genderqueer, nonbinary and agender first-years and first-years of other genders, whereas no genderqueer, nonbinary or agender respondents indicated voting for Trump.

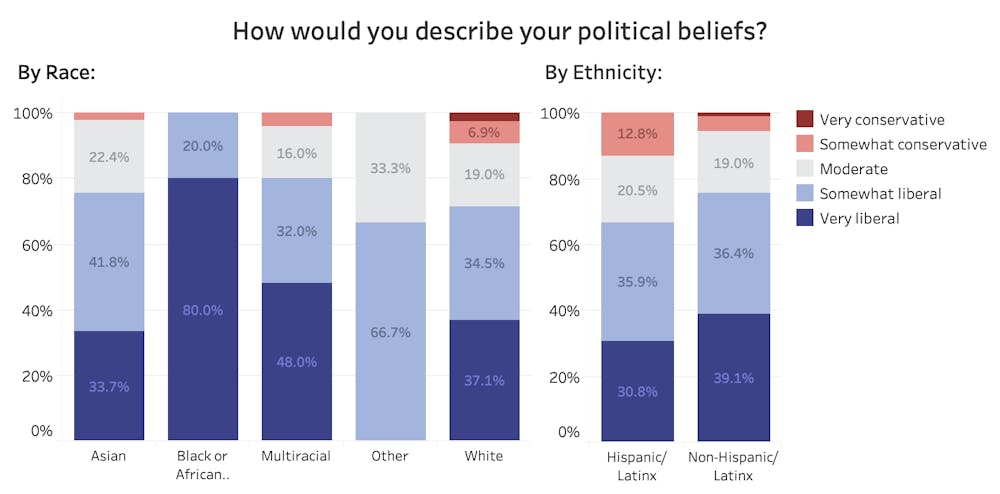
Political ideology: Trends by race, ethnicity, income, religiosity, sexual orientation, gender and school
Black or African American students have the highest percentage of “very liberal” students out of all racial groups. The majority of all racial groups identify as “very” or “somewhat” liberal.
All of our survey’s respondents who identify with very conservative political beliefs are non-Hispanic and Latinx white students. While a large majority of Hispanic and non-Hispanic students have liberal political beliefs, non-Hispanic and Latinx students are more likely to be “very liberal” than Hispanic and Latinx students—39.1% compared to 30.8%. Almost 13% of Hispanic and Latinx first-years are somewhat conservative, compared to 4.3% of non-Hispanic and Latinx first-years.
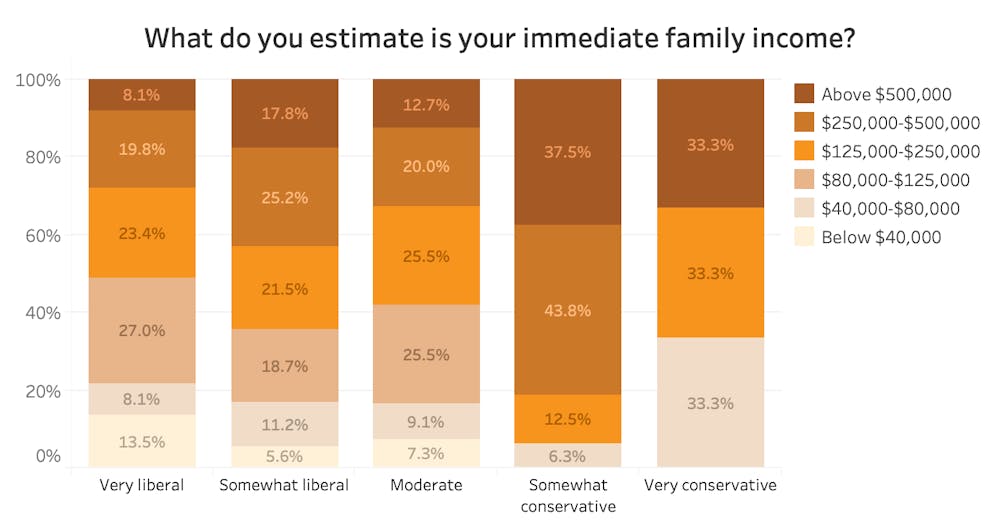
There is more income bracket diversity among moderate and liberal students than conservative students, who have higher incomes. All students with family incomes below $40,000 and between $80,000 and $125,000 reported “moderate,” “somewhat” or “very liberal” political beliefs. More than 80% of somewhat conservative first-years reported having family incomes of at least $250,000.
Furthermore, each political ideology is composed of 10 to 20% of legacy students—except for the “very conservative” category. Two of the three respondents in our survey who identified as “very conservative” are legacy students.
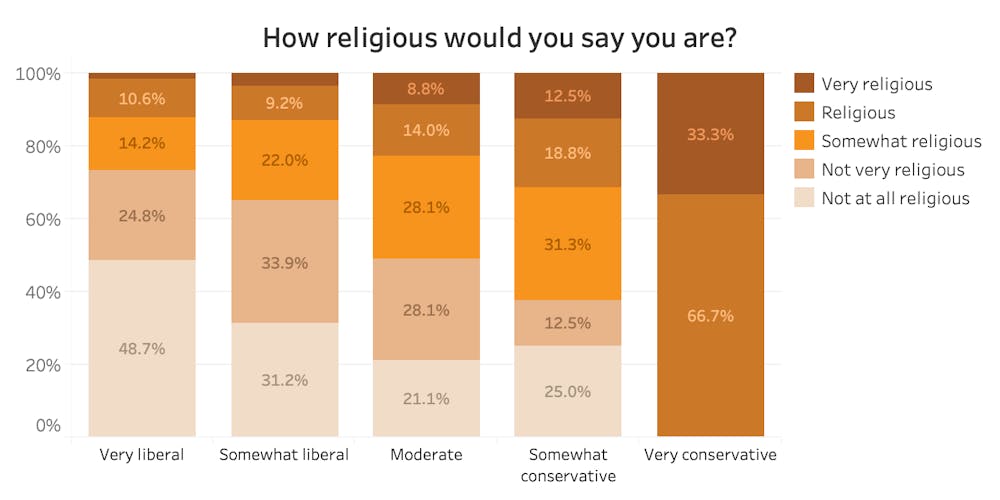
The more that first-years identify as liberal, the less religious they are, and vice versa. Nearly half of all “very liberal” first-years in our survey identify as “not at all religious,” whereas all “very conservative” students identify as “religious” or “very religious.”
Students who are “moderate,” “somewhat” or “very” liberal are more likely to identify with diverse sexual orientations and genders—as students identify as more liberal, there is greater representation of the LGBTQ+ community.
While all “somewhat” and “very” conservative respondents identify as heterosexual, nearly half of “very liberal” first-years identify as bisexual, gay, lesbian, homosexual, questioning, asexual and pansexual.
The majority of politically liberal and moderate first-years are cisgender women: 63.7%, 65.7% and 52.63% of cisgender women reported being “very liberal,” “somewhat liberal” and “moderate,” respectively. Meanwhile, the majority of conservative first-years are cisgender men: 66.7% and 56.3% of cisgender men reported being “very conservative” and “somewhat conservative,” respectively.
All gender queer, non binary and agender respondents identify as “very” or “somewhat” liberal.
Students in the Trinity College of Arts and Sciences are slightly more likely to be liberal than Pratt School of Engineering students. Generally, as students identify as more politically conservative, the more likely they are to be in the Pratt School of Engineering. More than 70% of “very liberal,” “somewhat liberal” and “somewhat conservative” first-years are enrolled in the Trinity College of Arts and Sciences.
Get The Chronicle straight to your inbox
Signup for our weekly newsletter. Cancel at any time.

Stefanie Pousoulides is The Chronicle's Investigations Editor. A senior from Akron, Ohio, Stefanie is double majoring in political science and international comparative studies and serves as a Senior Editor of The Muse Magazine, Duke's feminist magazine. She is also a former co-Editor-in-Chief of The Muse Magazine and a former reporting intern at PolitiFact in Washington, D.C.
Preetha Ramachandran is a Trinity senior and diversity, equity and inclusion coordinator for The Chronicle's 118th volume. She was previously senior editor for Volume 117.