Editor's note: This story is part of a series about the Class of 2024 based on a survey conducted by The Chronicle. You can read more about our methodology and limitations here, or see all of our survey coverage here.
The Chronicle’s first-year survey asked the Class of 2024 to describe their paths to Duke, including legacy or first-generation status, type of high school attended and whether or not students receive financial aid.
Of respondents, 52% applied to Duke Early Decision and 48% applied Regular Decision decision. Furthermore, 5.7% were accepted off the waitlist. Recruited varsity athletes make up only 2% of survey respondents.
Just over 14% of first years have parents or siblings who attended Duke. Approximately 9% of survey respondents are first-generation college students.
Compared to the national median household income of $68,703 in 2019, that of Duke undergraduate students sits above $180,000. Slightly more than half of first-year students—about 51%—are on financial aid.
Around 71% of first-years attended public high schools, while 27% attended private high schools and 1.7% indicated attending some “other” school.
Additionally, 22.2% of first-years indicated that they hired a private college admissions counselor during the admissions process.
First-years applied to a median of nine schools and were accepted to a median of four schools. More than 60% reported that Duke was their first choice school.
How do early and regular decision students differ?
Greater racial, ethnic, gender and sexual orientation diversity among regular decision students
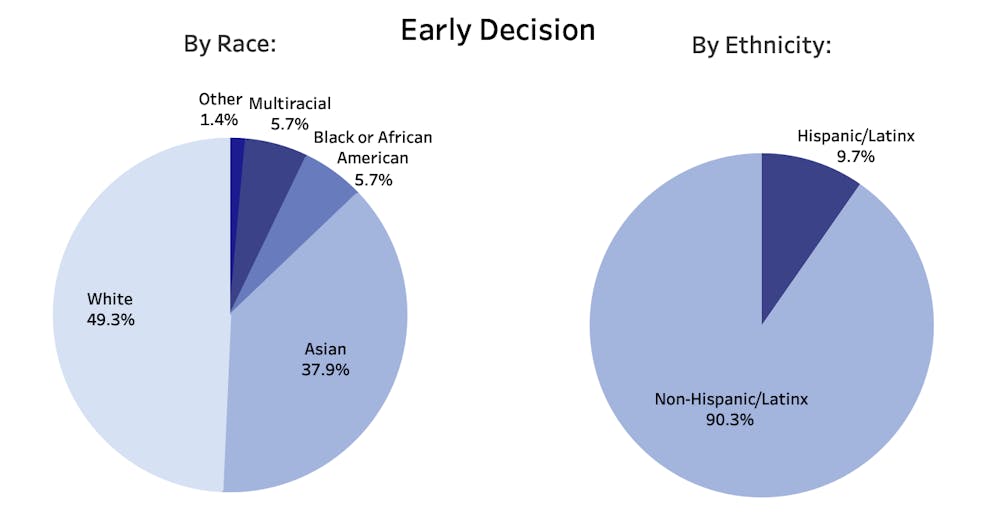
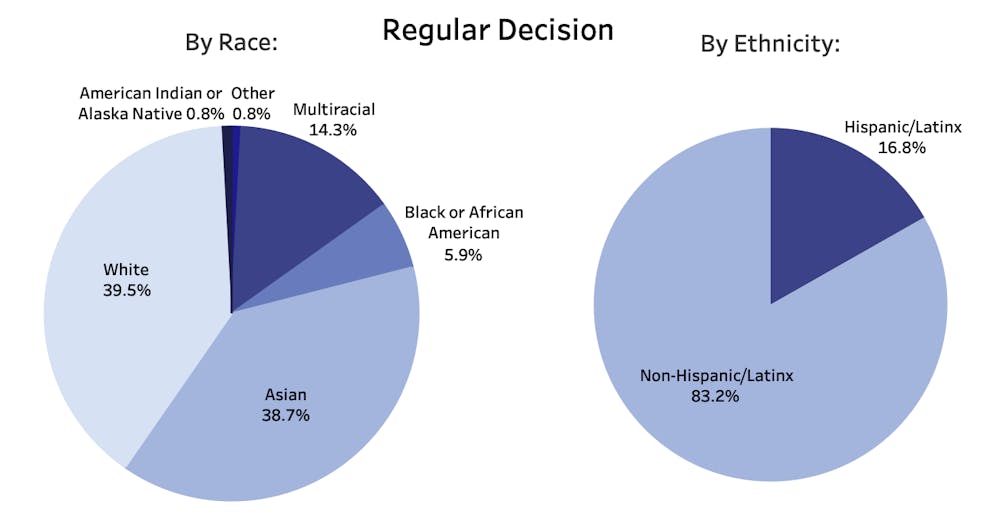
There is more racial and ethnic diversity among Regular Decision applicants. Around 49% of students who applied early identify as non-Hispanic white, compared to 39.5% of students who applied Regular Decision. This trend is mostly attributable to a significantly greater proportion of multiracial students who applied regular than early—14.3% compared to 5.7%. Furthermore, while Hispanic and Latinx first-years made up about 10% of Early Decision applicants, they made up around 17% of Regular Decision applicants.
Among Early Decision applicants, 98.1% identify as either a cisgender man or cisgender woman, 1.3% identify as genderqueer and nonbinary and 78.9% identify as heterosexual. In contrast, 95.1% of Regular Decision applicants identify as cisgender, 2.1% identify as genderqueer, nonbinary or some other gender, 0.7% identify as agender and 72.7% identify as heterosexual.
Rural students least likely to apply Early Decision
First-years from urban communities were most likely to have applied Early Decision, followed by suburban students. While 60.5% of urban and 51.4% of suburban students applied Early Decision, only 44.4% of rural students did.
Students on opposite ends of income ladder more likely to apply Early Decision
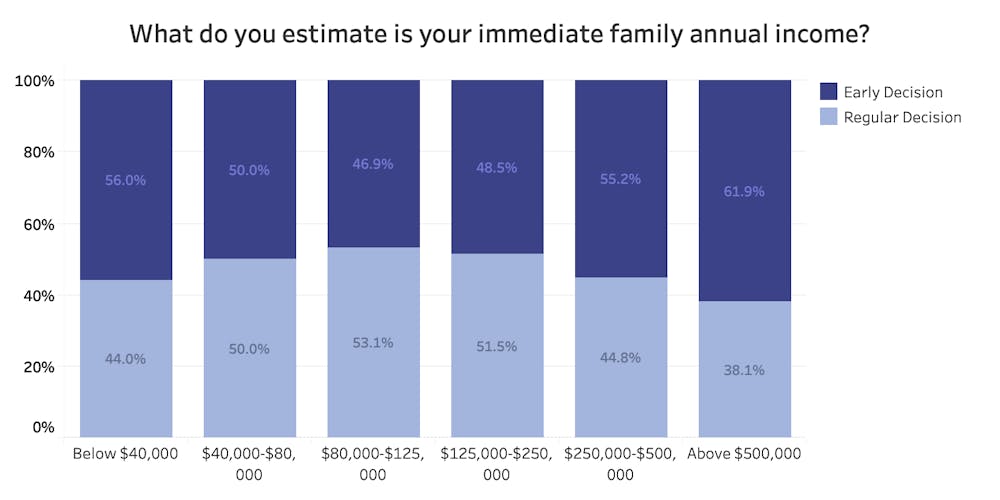
Students from the below $40,000, $250,000-$500,000 and above $500,000 income brackets were more likely to apply Early Decision than Regular Decision. Those from the above $500,000 bracket were more likely than those from the below $40,000 bracket to apply Early Decision—61.9% and 56%, respectively. Students in all other income brackets were either equally likely or more likely to apply Regular Decision than Early Decision.
Comparing legacy and non-legacy first-years
White, non-Hispanic students more likely to be legacy students
Non-Hispanic white respondents are more likely to have legacy status compared to other racial groups. The Chronicle’s survey found that 19.8% of white students are legacy students, compared to 13.3% Black or African American students and 9.1% of Asian students.
Similarly, while 15.1% of non-Hispanic and non-Latinx students indicated legacy status, 10.5% of Hispanic and Latinx students did. Consistent with last year’s survey results, legacy students were more likely to apply Early Decision to Duke.
Rural, low-income students least likely to be legacies
No survey respondents from rural communities are legacy students. Just over 88% of legacy students are from suburban communities and 11.6% are from urban communities.
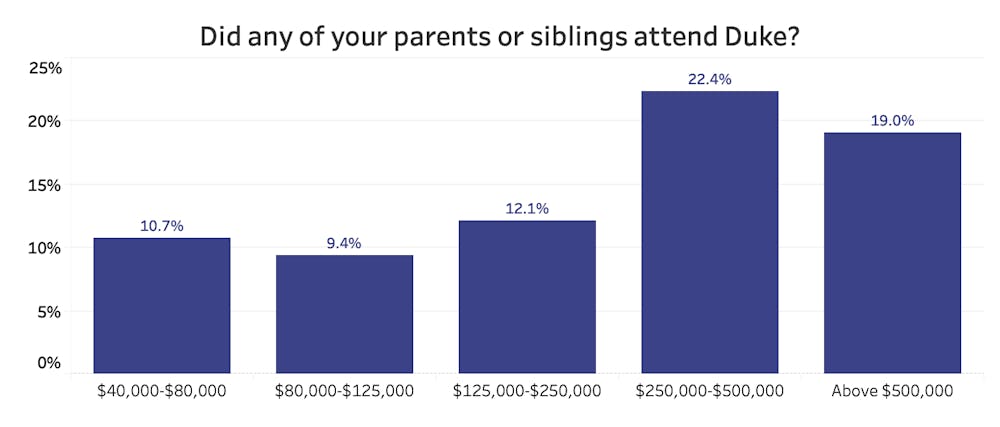
No respondents from the below $40,000 income bracket are legacy students, and the likelihood of being a legacy student increases as incomes increase. Students from the $250,000-500,000 income bracket are most likely to be legacies, at 22.4%.
Black, Hispanic, first-generation students more likely to come from low-income backgrounds
Black or African American and Hispanic and Latinx first-years were most likely to be from lower income brackets compared to other races and non-Hispanic and Latinx students. Compared to 35.1% of white and 33.3% of Asian first-years in the lower three income brackets, there are 80% of Black first-years between “below $40,000” and “$80,000-$125,000.” While 38.9% of non-Hispanic and Latinx first-years are in these lower brackets, 44.4% of Hispanic and Latinx first-years are.
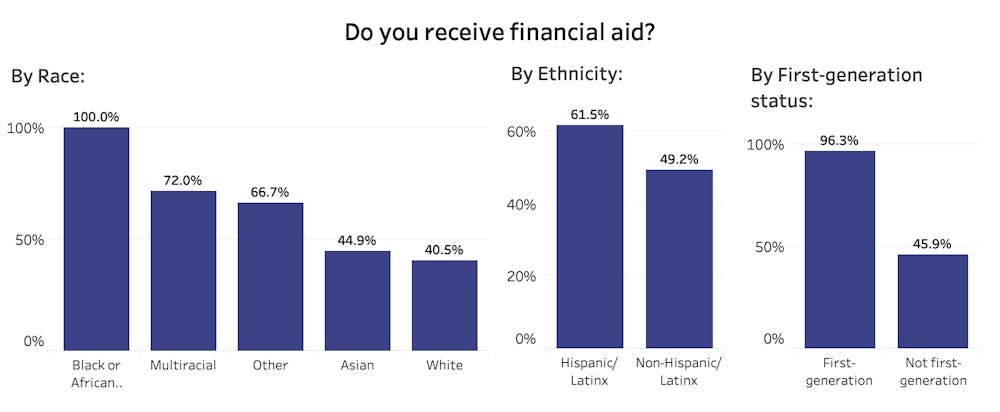
Similarly, all Black respondents indicated that they receive financial aid at Duke, compared to 40.5% of white respondents, who were the least likely of all races to receive financial aid. Similarly, while 61.5% of Hispanic and Latinx first-years receive financial aid, but 49.2% of non-Hispanic or Latinx first-years receive aid.
Among first-generation college students, roughly 85% report being in the “below $40,000” or “$40,000-$80,000” income brackets—compared to just 11% of non-first-generation students who indicated being in those same income brackets. No first-generation first-year reported coming from incomes exceeding $250,000. Also, 96.3% of first-generation students receive financial aid, compared to 45.9% of non-first-generation students.
While none of the Black respondents are first-generation students, around 13% of Hispanic and Latinx respondents are, compared to about 8% of non-Hispanic and Latinx respondents.
Note: The "American Indian or Alaska Native" category was excluded from analysis because it contained only one student. There were only three students in the "Other" category.
High-income, early decision students more likely to have attended private high schools
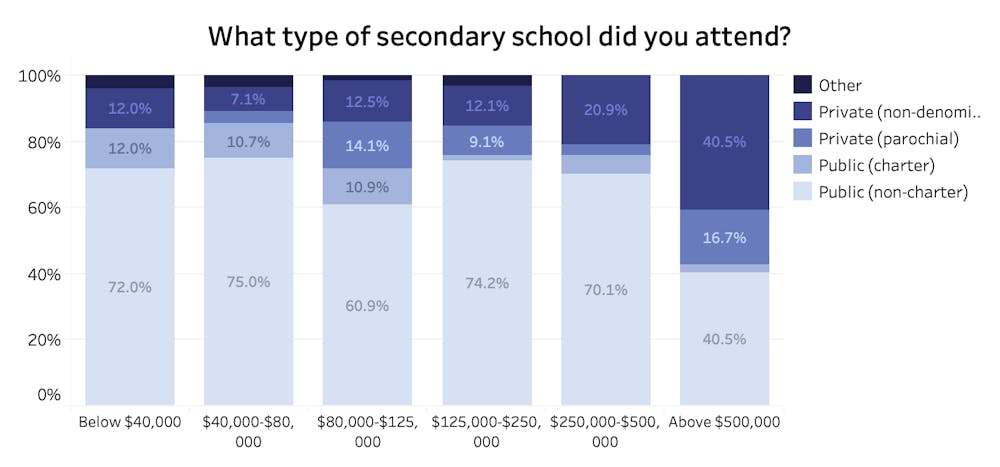
Students with family incomes above $500,000 were most likely to have attended both parochial and non-denominational private secondary schools. Meanwhile, first-years in the ”below $40,000” and “$40,000-$80,000” brackets were most likely to attend public charter or non-charter secondary schools. For example, 84% of students from the “below $40,000” bracket attended a public school, compared to 42.9% of students from the “above $500,000” bracket.
A greater proportion of Early Decision applicants also attended private schools than Regular Decision applicants—32.7% versus 19.4%. This could be a reflection of the higher family annual income among Early Decision applicants noted previously.
Moreover, although a similar proportion of Trinity College of Arts and Sciences and Pratt School of Engineering first-years attended private schools—25.9% and 28%, respectively—more Pratt students attended parochial private schools—6% Trinity versus 17% Pratt—and more Trinity students attended non-denominational private schools—20% Trinity compared to 12% Pratt.
White, Asian, high-income students more likely to have hired a private admissions counselor
While no Black or African American respondent hired a private admissions counselor, around 27% of both white and Asian students did. The greatest percentage of students who hired a counselor fell under the highest income bracket—above $500,000—with usage of counselors decreasing as income fell.
More Trinity students express that Duke was their first choice
Trinity students were more likely than Pratt students to report that Duke was their first choice—66.4% versus 55.1%, respectively. A greater proportion of Trinity first-years also applied Early Decision to Duke than Pratt first-years—54.1% compared to 46.4%. However, similar percentages of Trinity and Pratt first-years are legacies—14.5% of Trinity and 14.4% of Pratt students.
When asked their primary reason for choosing Duke, more Trinity students than Pratt students mentioned the desire to take advantage of Duke’s “pre-professional opportunities and alumni network”—10% in Trinity compared to 1.4% in Pratt.
Get The Chronicle straight to your inbox
Signup for our weekly newsletter. Cancel at any time.