Editor's note: This is part of a series about the Class of 2023 based on a survey conducted by The Chronicle. You can learn more about the methodology and limitations of the survey here. Read all of our survey coverage here.
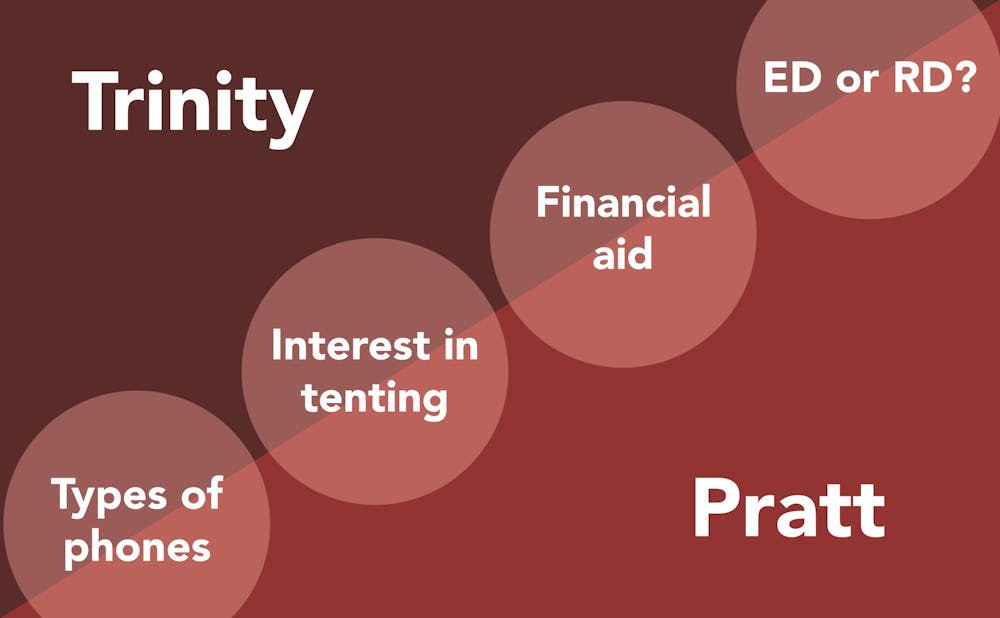
In the Class of 2023, 80% of students are in the Trinity College of Arts and Sciences, and 20% are in the Pratt School of Engineering. Of the 193 participants who completed The Chronicle's Class of 2023 survey, 145 (75%) are in Trinity and 48 (25%) are in Pratt. Below are some of the differences between Trinity and Pratt first-years in terms of the round in which they applied, their interest in tenting and other characteristics.
First-year Pratt students about twice as likely as first-year Trinity students to live outside the United States
Compared to 6% of Trinity survey respondents, 13% of Pratt respondents have their permanent home outside the United States.

Nearly double the number of first-year Trinity students applied Early Decision compared to first-year Pratt students
Although only a quarter of surveyed Pratt first-years applied Early Decision to Duke, 47% of Trinity first-years applied Early Decision.

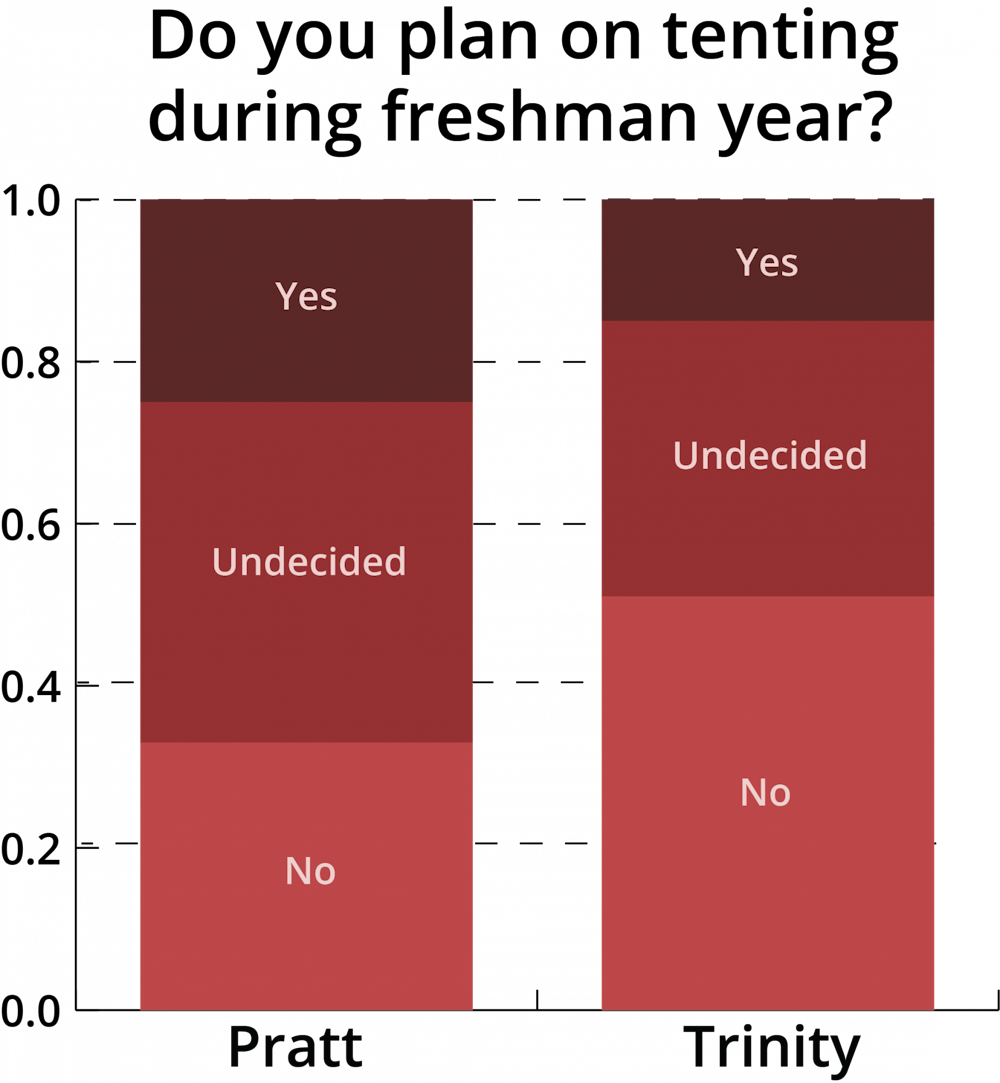
Pratt first-years are nearly twice as likely to be interested in tenting this year than Trinity first-years
In our survey, 25% of our Pratt respondents expressed interest in tenting in 2020, whereas only 15% of Trinity first-years expressed interest. More than half of Trinity first-years were not interested, and 33% of Pratt first-years were not interested.
More Pratt first-years receive financial aid than Trinity first-years
Of the Pratt first-years we surveyed, the majority—65%—receive financial aid. Half of the sampled Trinity first-years receive financial aid.

Sampled Trinity first-years are more than four times as likely to be legacy students than Pratt first-years
19% of Trinity survey respondents have parents or siblings who attended Duke, compared to only 4% of Pratt survey respondents.

More Trinity first-years use Apple products than Pratt first-years
94% of first-years in Trinity use an iPhone, while 83% of Pratt first-years use an iPhone. Overall, 92% of the sampled Class of 2023 opt for an iPhone.
Similarly, compared to 70% of first-years in Trinity have a MacBook, only 44% of first-years in Pratt use a MacBook. Overall, 64% of the Class of 2023 own a MacBook.
More Pratt first-years took both the SAT and ACT than Trinity first-years
29% of first-years in Pratt took only the SAT, 29% took only the ACT and 42% took both. 37% of first-years in Trinity took only the SAT, 36% took only the ACT and 28% took both.
More Trinity first-years have a total annual family income greater than or equal to $125,000
60% of first-years in Trinity and 42% of first-years in Pratt have a total annual family income greater than or equal to $125,000. The largest income brackets for families of Trinity first-years are $125,000-$250,000 (23%) and $250,000-$500,000 (23%). The largest income bracket for families of Pratt first-years is $80,000-$125,000 (35%).
Get The Chronicle straight to your inbox
Signup for our weekly newsletter. Cancel at any time.

Mona Tong is a Trinity senior and director of diversity, equity and inclusion analytics for The Chronicle's 117th volume. She was previously news editor for Volume 116.