How rich are the schools that Duke students come from?
My fellow columnists have written column after column after column calling for housing reform. Even I have written about it, twice. A few weeks ago, the Chronicle laboriously assembled a dataset for the 1,739 students who entered as the class of 2018 to examine homogeneity in Greek life. Most of those students, assuming they didn't transfer and are graduating on time, are now seniors.
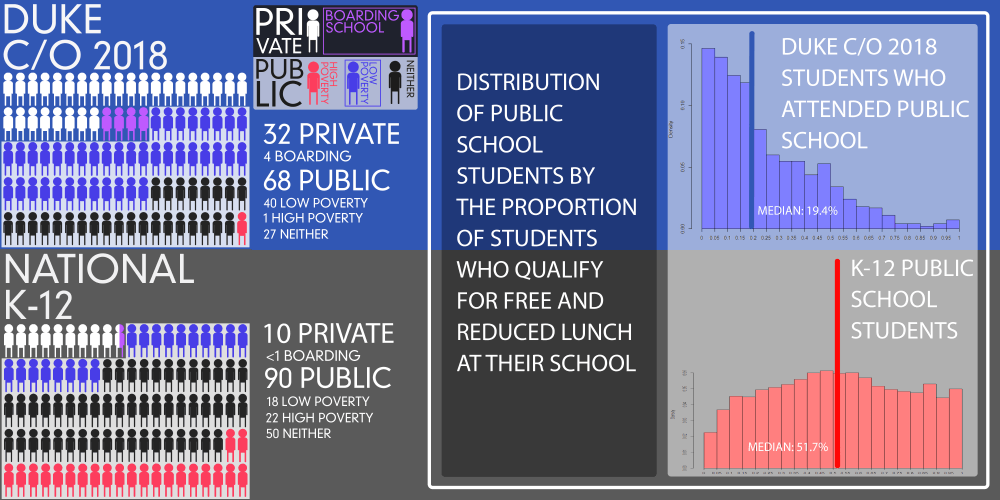
But how much of the problem stems from the structures that exist on campus, and how much is due to the composition of the student body to start with? The same dataset in the Greek life article also shows the following: If the entire senior class were reduced down to 100 people, this is what their high school breakdown would look like:
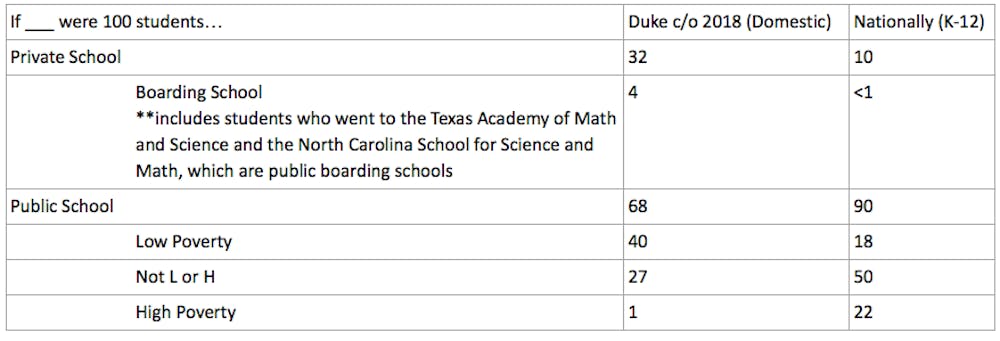
Nationally, 28 percent of K-12 students attend a private school or a low-poverty public school. In the senior class, that proportion is a whopping 72 percent, more than 2.5 times the national proportion.
Perhaps more striking: Nationally, 22 percent of K-12 students attend a high-poverty public school. In the senior class, that figure is 1 percent—just 21 students.
Context behind the statistics
Private/Boarding School:
Of the 1,514 students who went to a high school in the United States, 484, or 32 percent, went to a private high school. Eight were homeschooled, and the rest went to public school. 62 students (including 8 who went to the public boarding schools TAMS and NCSSM), or 4 percent, went to a boarding school.
In contrast, 10.2 percent of students in the United States as of January 2018 attended a private high school, according to the NCES. Roughly 0.5 percent of students attend a boarding high school.
Low Poverty/High Poverty:
The percentage of students qualifying for free and reduced lunch is a traditional proxy to examine the overall wealth of a school. In the 2014-2015 school year, 51.8 percent of public school students nationwide qualify for free and reduced lunch. The cutoffs to qualify are 130 percent of the poverty rate for free lunch, and 185 percent for reduced lunch. For a family of 4 in the 2017-2018 school year, the cutoff for reduced lunch was a family income of $45,510.
The National Center for Education Statistics (NCES) defines low poverty schools as schools with fewer than 25 percent of its students on free or reduced lunch and high poverty schools as those with more than 75 percent of its students on free or reduced lunch. Nationally, only 20 percent of public school students attend low-poverty schools, and about 24 percent of students attend high poverty schools.
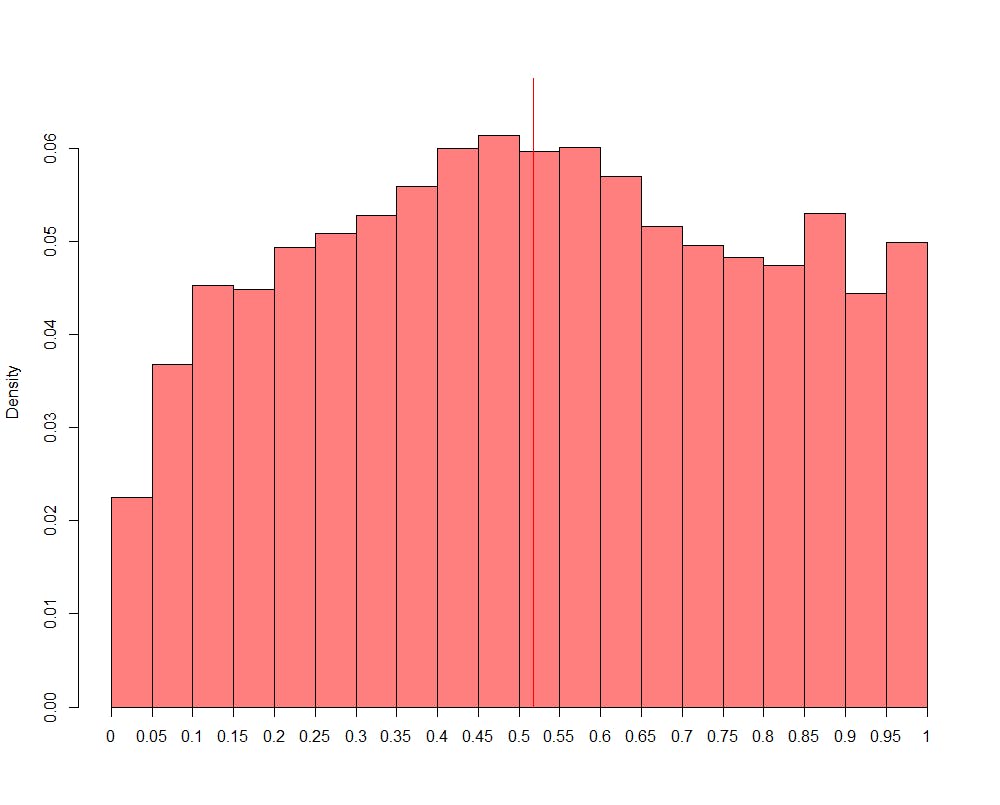
Based on data from the NCES, this is the distribution of K-12 students nationally by the proportion of free and reduced lunch students at their school.
This is what it looks like at Duke:

The x- axis represents proportions of students on F+R lunch at a school. The y-axis represents the proportion of students who go to a school with that proportion of students on free and reduced lunch.
Nationally, the median public school student attends a school where 51.7 percent of students qualify for free or reduced lunch. At Duke, the median is 19.39 percent. In fact, 897 out of 1022, or 87.8 percent, of Duke students come from public schools where the proportion of students receiving free or reduced lunch is below the national median .
Family income and qualifying for financial aid have traditionally been the lens for examining elitism at Duke. And the statistics have been revealing and widespread: Median family income at Duke is $186,700, well within the top 10 percent of families. 19 percent of students come from the top 1% of families (minimum income $630K). Half of students are paying full price.
But even if a student makes below median income, went to a public school, and qualifies for financial aid, that doesn't necessarily mean we're off the hook. The public schools that Duke students come from, much like the student body, skew towards the wealthy.
Perhaps judging people by the school they went to is just as bad as judging someone by their hometown, sexuality, race, or the color of their socks. After all, most students didn't pick the school they attended, just like they didn't pick their hometown, sex at birth, or race. If anything, their parents were more influential in these decisions.
Additionally, there are things the data can't capture. There are students who've probably gone to multiple schools across the socioeconomic spectrum throughout their schooling career. A uniform measure for free and reduced lunch nationally doesn't consider different costs of living across cities. Self segregation by socioeconomic status likely happens within schools, so a seemingly socioeconomically diverse student body on paper may still lack diversity.
But it'd also be wrong to deny that K-12 schools shape an important part of our individual identities. Aside from teaching us the material that prepared us for college (or not), schools also play a major part in shaping our social circles pre-Duke, in the same way that Duke influences and shapes our future social and professional networks.
For many institutional reasons, Duke may not draw a socioeconomically diverse class. After all, parental income is a huge predictor of college access in the first place. But if people are pushing for housing reform and changes to Greek life in the name of being able to interact with a diverse group of people, it may be time to reconsider. Duke may be much more diverse than some students’ hometowns, at least in some regards. But are the only forms of diversity worth pursuing the ones that Duke endorses?
Amy Fan is a Trinity sophomore. Her column, “fangirling,” runs on alternate Wednesdays.
Get The Chronicle straight to your inbox
Signup for our weekly newsletter. Cancel at any time.
Amy Fan is a Trinity senior. Her column, "fangirling," runs on alternate Thursdays.